


BibTeX | RIS | EndNote | Medlars | ProCite | Reference Manager | RefWorks
Send citation to:
URL: http://journal.zums.ac.ir/article-1-6082-en.html


2- Dept.of Health Information Technology,School of Allied Medical Sciences, Tehran University of Medical Sciences, Tehran, Iran.
3- Dept. of Health Information Technology, Abadan Faculty of Medical Sciences, Abadan, Iran. ,
✅ According to the results, we concluded that the J-48 could provide better insights than other proposed prediction models for clinical applications.
Colorectal cancer (CRC) is the most common gastrointestinal malignancy and the third leading cause of mortality in the world (1, 2). The CRC remains a critical challenge for communities’ health with the estimated annual new case and mortality of one million and a half million, respectively (3, 4). The incidence of CRC has risen in low-income countries constantly over the past few decades (5, 6). This disease is becoming the first cause of cancer-related death in Asian developing countries (7). Iran has the third- and fourth-highest incidence rates among females and males, respectively (8). The CRC growth rate in Iran is expected to double over the next two decades and is considered a critical health challenge (9).
Despite advancements in diagnostic approaches, more than 90% of CRC cases had either progression or metastasis after diagnosis. Early detection can significantly improve the overall survival possibility in CRC patients (3, 10). Currently, colonoscopy and sigmoidoscopy are the most common CRC screening approaches. However, these techniques have some drawbacks, including being invasive, inconvenient, high costs, and suboptimal sensitivity and specificity. As a result, many people are reluctant to undergo these procedures.
Fecal occult blood test (FOBT) is another diagnostic method for detecting CRC. This technique has the benefits of being non-invasive and cost-effective. However, FOBT has not been broadly accepted due to its relatively low accuracy (3, 11). Therefore, establishing a CRC surveillance system for the regular screening of individuals using their risk factors is a priority for early and accurate CRC prediction. To meet this goal, accurate forecasting methods, such as data mining with high‐quality data and minimum error rate are needed (12).
Data mining is the process of selecting, discovering, and modeling huge volumes of data for extracting concealed patterns or potential relationships that provide valuable information. Mining healthcare data could improve medical evaluation screening, prognosis, diagnosis, treatment, and survival leading to enhanced clinical decision-making (13, 14).
According to the literature, little research has been conducted on using data mining to generate predictive models for CRC prognosis. Therefore, this study developed four widely-used data mining techniques, namely J-48, Bayesian net, random forest, and multilayer perceptron (MLP). Moreover, their CRC risk prediction performances were analyzed and compared.
This applied descriptive research was conducted in 2019. We applied data mining classification algorithms using a dataset of CRC risk factors. Our main goal was to compare the performance of different data mining methods for CRC risk prediction.
Dataset Description and Preprocessing
The dataset used in the present study was obtained from Imam Hospital, Sari, Iran. The medical records of the patients with CRC were reviewed by health information management experts. The inclusion criteria encompassed referring to the hospital for the screening, diagnosis, and treatment of CRC and signing informed consent.
The information content of 760 cases out of 800 records was complete. Forty incomplete case records were excluded due to the missing of more than 70% of the data. Moreover, to investigate on people without high-risk factors of CRC, the patient's records containing CRC high-risk factors according to the CRC screening guidelines (such as American Cancer Society and CRC Consortium) including the personal and family history of adenoma polyposis, Inflammatory Bowel Disease (IBD), CRC relative history, patients under 60 age years old with familial history of CRC and Hereditary cancer syndromes, such as Lynch syndrome, were excluded from the study (292 cases). This limitation was done to analyze the effects of other risk factors in developing CRC. Some dataset samples from the Imam Hospital data repository are depicted in Figure 1.
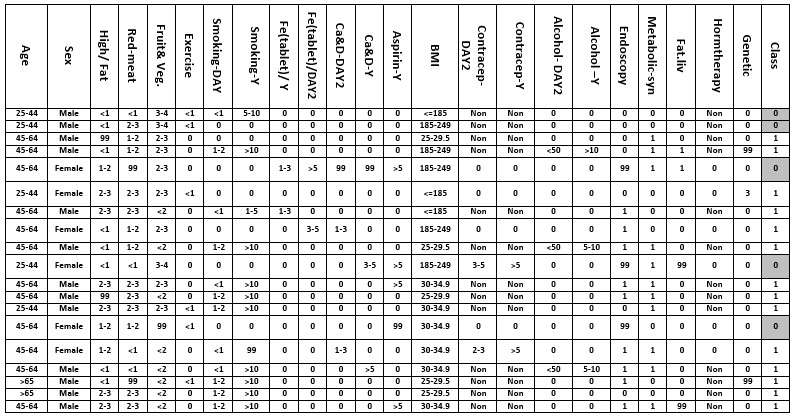
Figure 1. Dataset sample associated with CRC risk factors
Feature Selection
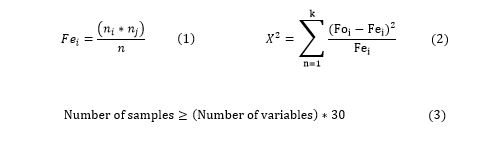
To reduce the dimensions of the dataset and improve the efficiency of data mining algorithms, the possible factors for CRC were scored using the Chi-square correlation coefficient technique. Feature selection automatically selects the most important input features known as independent variables from the dataset contributing to the classification and assignment of cases based on the target output known as dependent variables.
Appropriate feature selection methods, including univariate selection, recursive feature elimination, principal component analysis, and feature importance must be used to elevate the performance of data mining algorithms. In this research, we applied the weight statistical Chi-square test in Rapid miner software to identify the most important attributes in the CRC dataset. This test is based on the difference between the observed and expected values (Equation 1) and is used to determine the significance of the relationship between independent and dependent variables. The feature importance is calculated based on Equations 2 and 3.
Predictive Models
Four selected data mining algorithms were utilized due to their common usage in recently published studies with the high performance of classification. We present a brief description of these four algorithms is here.
J-48
The J-48 is an important decision tree algorithm. Its capabilities include missing values accounting, decision tree pruning by determining confidence factors, extracting rules, and considering continuous attribute value ranges. These features make the J-48 algorithm a better choice than the other tree algorithms. This algorithm uses divide and conquers strategies for decision tree making based on independent and dependent variables.
In each node of the tree, the splitting function is completed by an attribute that can predict samples in each class more precisely. Initially, the J-48 rule sets are made by an unpruned tree, and each path from the root node to leaf is transformed into a prototype rule associated with the leaf node label. In the current study, the decision tree was made with the confidence of 0.2 to include all independent variables with maximum performance (15).
Random Forest
This algorithm is applied in datasets with a large dimension. It applied additional layers of randomness than other decision tree algorithms. Node splitting processes in the RF algorithm is performed by a random subset of predictors. The latter process in RF is different from other algorithms in which it is completed by the best all variable splitter. The diversity of trees is important in random forest performance (16).
Bayesian Network
In this method, the degree of dependency between the independent variables and the output class can be shown by directed acyclic graph conditional probability methods. This graph shows the variables, each of which occurs independently (17, 18). In the present study, the Bayesian network determined the probability of CRC occurrence based on the factors occurrence and frequency independently.
Multilayer Perceptron
An MLP is a feed-forward artificial neural network (ANN) model for predicting the class label of tuples. An MLP is composed of multiple layers of nodes in a directed graph, every layer of which is fully connected to the next one. Except for the input nodes, every node is a neuron (or processing element) with a nonlinear activation. An ANN consists of input, output, and processing (hidden) layers. Each layer contains a group of neurons that are generally associated with all the neurons of the other layers (19). In this study, an MLP with 45 sigmoid nodes was used to develop a CRC risk prediction model.
Performance Evaluation Measures
In order to evaluate the predictive performance of models, we applied some evaluation measures, including precision, sensitivity, and F-measure. The first measure is precision as shown in Equation 4, which measures the probability of a positive prediction being correct. The second measure is sensitivity as shown in Equation 5 and is referred to as the proportion of positive cases that are classified as positive. Specificity refers to the proportion of negative cases classified as negative. The last measure is the F-measure as shown in Equation 6, which measures the probability of a positive prediction being correct.
The confusion matrix (Table 1) helps implement an evaluation step in classifying for prediction. For the prediction process, each sample can be classified into two classes of CRC and non-CRC. This matrix consists of four elements, namely True Positive (TP), True Negative (TN), False Positive (FP), and False Negative (FN). The TP indicates that the prediction result of the representation is CRC and is consistent with its real class. The TN means that the prediction result of the sample is non-CRC and consistent with its actual class. The FP is the non-CRC sample predicted as CRC, and FN refers to a result expected as non-CRC with the actual result being CRC (20, 21).
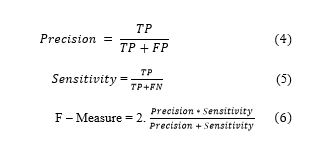
Table 1. Confusion matrix
| Real | Predicted | |
| Positive | Negative | |
| Positive | True Positive (TP) | False Negative (FN) |
| Negative | False Positive (FP) | True Negative (TN) |
The present study was conducted on 468 participants, including 194 colorectal cancer patients (42.5%) and 274 (58.5%) control subjects. After feature selection, we obtained 15 clinical features as the most important risk factors of CRC prediction according to Equation 2 and 3. The results indicated that cigarette smoking (a packet per day) and a history of metabolic syndromes with the values of 63.046 and 0.01 were the most and least important risk factors of CRC, respectively (Table 2).
Table 2. Important variables selected for CRC risk prediction
| Chi-square value | Variable values | Variable | |
|---|---|---|---|
| 63.046 | No smoking, 1–4 cigarettes, 4-8 cigarettes, 8-12 cigarettes, 12 > cigarettes, unknown | Smoking (In day) |
|
| 36.225 | Day variable ranges for 1 year (365 day) | Smoking (In years) | |
| 43.328 | No exercise, <15 minute, 15 - 30 minute, 30 - 45 minute, >30 minute. , unknown | Exercise (In day) | |
| 42.038 | Not consumption, < 50 gram, 50-100 gram, 100-150 gram, 150-200 gram, 200> gram, Unknown | Animal Fat (In day) | |
| 41.727 | Red meat (In day) |
||
| 27.080 | Not consumption, < 100 gram., 100-200-gram, 200-300 gram, 300-400 gram, 400> gram, Unknown | Fruits and vegetables (In day) | |
| 27.069 | Not taking, < 50 mili gram, 50-100 mili gram, 100-200 mili ram, 200-300 mili gram, 300> mili gram, Unknown | Aspirin pill (In day/2) |
|
| 27.080 | Contraceptive pill (In day) |
||
| Iron supplement (In day) | |||
| 8.464 | |||
| 19.416 | Day variable ranges for 1 year (365 day) | Contraceptive pill (In year) | |
| 11.263 | Day variable ranges for 1 year (365 day) | Aspirin pill (In year) | |
| 7.886 | Day variable ranges for 1 year (365 day) | Iron supplement (In year) | |
| 9.235 | <18.5 kg/m2 , 18.5-24.9 kg/m2, 25-29.9 kg/m2, 30 > kg/m2 Unknown |
Body Mass Index (BMI) | |
| 18.172 | No alcohol drinking , <20 gram, 20–59 gram, 60–139 gram, 140–179 gram, ≥180 gram, unknown | Alcohol (In day) | |
| 12.389 | Day variable ranges for 1 year (365 day) | Alcohol (In year) |
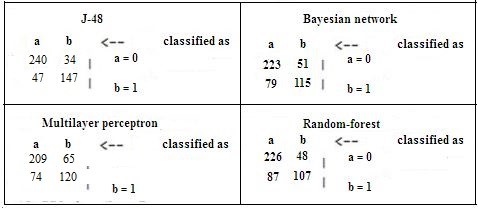
A 10% cross-validation was considered for bias embedded in the performance of data mining algorithms. The result of comparing the four data mining algorithms based on the evaluation criteria showed the CRC prediction precision of 0.826, 0.709, 0.719, and 0.701 for J-48, random forest, Bayesian net, and MLP, respectively. The F-measure values for CRC prediction were found as 0.826 in the J-48 model, 0.705 in a random forest, 0.718 in the Bayesian net, and 0.702 in MLP.
Moreover, the sensitivity of CRC prediction was 0.827, 0.712, 0.722, and 0.703 for the J-48 model, random forest, Bayesian net, and MLP, respectively. The AUC values in CRC prediction were 0.881 in the J-48 model, 0.758 in a random forest, 0.784 in the Bayesian net, and 0.765 in MLP (Table 3). The findings of comparing the receiver operating characteristic curves for selected data mining algorithms are shown in Figure 2.
Table 3. DM algorithm confusion matrix
.JPG)
The comparison of these four data mining algorithms revealed that the J-48 decision tree algorithm (Figure 3) is better than other algorithms in all the investigated performance aspects. Therefore, we extracted some rules with the structure of IF-THEN from this algorithm for interpreting the clinical findings acquired in this algorithm.
-
IF (Smoking-day==0 && Aspirin-(Days/2) ==0 && Alcohol (In years) ==0 && Fruits and vegetables <=2 && Fat-meal <=1) THEN Class= 0 (Low risk).
-
IF (Smoking-day==0 && Aspirin-(Days/2) ==0 && Alcohol (In years) ==0 && Fruits and vegetables <=2 && Fat-meal == 1-2) THEN Class= 1 (High risk).
The interpretation of Rule 1 demonstrated that, for example, if a person did not consume any cigarettes, aspirin tablets, or alcohol in a day, and consumed < 200 g of fruits and vegetables and < 50 g of animal fats in a day, this algorithm classified him as low-risk similar to the pattern of non-CRC people investigated in this research. With the characteristics of Rule 1 (except animal fat consumption of 50-100 g in Rule 2), this algorithm classified this person into the high-risk group, which is similar to the pattern of CRC people.
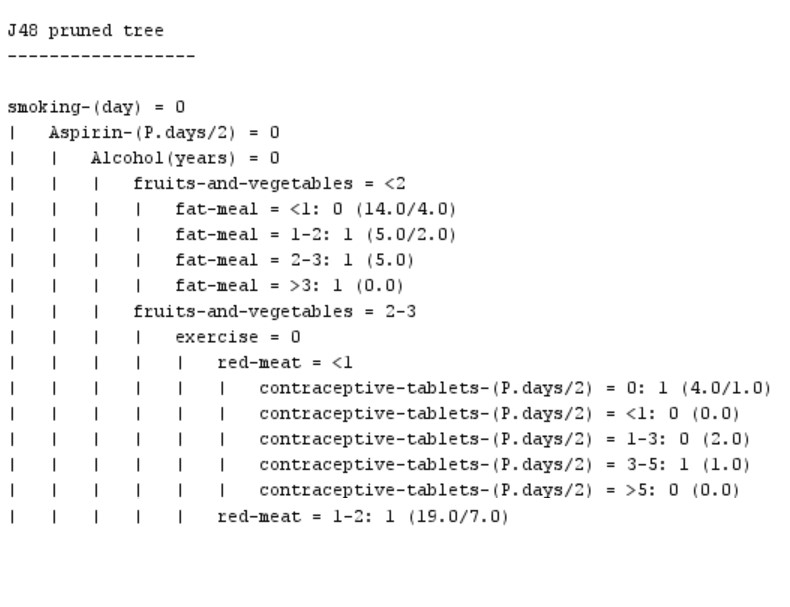
Figure 3. A part of the J-48 decision tree algorithm
Discussion
The main goal of this study was to compare the performance of four classification algorithms, namely J-48, Bayesian net, random forest, and MLP for predicting CRC. Results showed that all classification algorithms were acceptable and could give reasonable responses. However, J-48 had the best performance for all evaluation measures.
Much research has compared the performance of different data mining techniques in medicine (22-24). Some have focused on early detection, risk assessment, diagnosis, treatment, and survivability estimation of CRC (25). Studies conducted by Nartowt et al. (26), Sha et al. (27), Chau et al. (28), and Wang and Lualdi (29, 30) showed that using ANN for CRC prediction, early diagnosis, and screening had high classification performance.
Pourhoseingholi et al. (2017) demonstrated that among the multiple data mining models, the random forest had the best capability for estimating CRC five-year survival (31). Zhang et al. (2016) evaluated the application of three machine learning algorithms, including logistic regression, SVM, and ANN for CRC diagnosis based on a serum tumor marker. Finally, the results indicated better performance for logistic regression in terms of early CRC diagnosis (32).
Pourahmad et al. (2016) presented that the hierarchal clustering method had higher sensitivity and fuzzy c-means with maximum specificity. As a result, these authors introduced it as a non-invasive, efficient, and effective model for CRC staging (33). We reviewed four data mining techniques demonstrating that the J-48 algorithm had the best performance. In conclusion, the J-48 algorithm is recommended for predicting CRC cases as a common model. Furthermore, it might be applied clinically in the future.
The CRC can be caused by numerous clinical and non-clinical factors (34). Given the multi-causal nature of CRC, predictive models can be useful for recognizing high-risk groups leading to early detection and the adoption of effective treatment plans (35). The CRC early diagnoses through scientific screening methods have been shown to increase survival chances (36). Regarding the timely and accurate prediction of CRC, a neoplasm with a high incidence and mortality rate provides a better plan for health policy to decrease complications and improve the patient’s survival probability (37).
The true prediction may enhance CRC treatment and elevate the survival rate of patients. The predictive models in our study can discriminate the high- and low-risk individuals for CRC. Individuals with the prediction values of 1 or 0 were judged as high- and low-risk for CRC, respectively.
The current study had some limitations. Firstly, the research database lacked enough quantitative data, which may diminish the precision in data mining. Secondly, this investigation was a retrospective single-center experience. Thirdly, the absence of integrated EMR with machine learning tools and manual data entry had a negative effect on data mining quality. Finally, the research dataset lacked some prognostic factors, such as the history of patients and their families, which might have negatively impacted CRC predictions. Evaluation of more data mining techniques, larger databases in different organizations, and prospective data collection approaches are recommended for improving the data quality criteria.
Conclusion
The present study evaluated and compared the efficiency of some data mining classifier algorithms in terms of the early prediction of CRC risk. We compared four prediction models for CRC incidence considering the most important factors. The results indicated that the J-48 algorithm had the best classification performance. This study may assist future researchers in choosing the optimal predictive models for implementing community lifestyle interventions to reduce the incidence of CRC. The results of comparing the performance of prediction models in this study were satisfactory and we believe that this process would be improved in case we could use more data samples in the study dataset.
Acknowledgements
This article is extracted from a research project which supported by Tehran University of Medical Sciences with the contract no IR.TUMS.SPH.REC.1398.191. We appreciate Research Deputy of Tehran University of Medical Sciences who sponsored this project financially.
Ethical considerations
Ethical issues (Including plagiarism, informed consent, misconduct, data fabrication and/or falsification, double publication and/or submission, redundancy, etc.) have been completely observed by the authors.
Funding and support
This study was part of an approved project funded by the Tehran Health Services Management Research Centre affiliated with the Tehran University of Medical Sciences particularly focusing at patient’s rights.
Conflicts of Interest
Authors declared no conflict of interests.
Received: 2020/06/23 | Accepted: 2020/07/16 | Published: 2020/12/4
| Rights and permissions | |
 |
This work is licensed under a Creative Commons Attribution-NonCommercial 4.0 International License. |
Copyright Policy
