


BibTeX | RIS | EndNote | Medlars | ProCite | Reference Manager | RefWorks
Send citation to:
URL: http://journal.zums.ac.ir/article-1-6160-en.html


2- Dept. of Health Information Technology and Management, School of Paramedical, Tehran University of Medical Sciences, Tehran, Iran
3- Dept. of Health Information Technology, Abadan Faculty of Medical Sciences, Abadan, Iran | Dept. of Student Research Committee, Abadan Faculty of Medical Sciences, Abadan, Iran
✅ Identification of diagnostic criteria has become the standard approach for disease modeling; it helps to design decision support tools. After analyzing and comparing six diagnostic performance measures, we observed that these variables have a high diagnostic power for COVID-19 detection.
In December 2019, the first confirmed human case of 2019 novel coronavirus (2019-nCoV) was identified in Wuhan city, Hubei province, China; later, the virus was named as coronavirus disease 2019 (COVID-19) (1-3). Given the high contagious power, nature complexity and uncertainty, daily exponential growth, and dramatic increase in the number of hospitalizations and mortalities, the World Health Organization (WHO) declared this outbreak as a public health emergency (4, 5). Despite severe preventive measures and complete lockdown policies by many governments, COVID-19 became a global pandemic, tremendously influencing health and safety of world inhabitants (6-8).
To cope with the COVID-19 crisis, healthcare industries are looking for the operative and cost-effective solutions to inhibit virus spread. In this way, early prediction, diagnosis, screening, and consequently rapid isolation of infected or pre-symptomatic cases are essential to control the disease and thereby reduce the occurrence (9, 10). With increasing numbers of confirmed positive cases and lack of proper treatment and immunization plans, a great pressure is imposed on the healthcare systems due to severe scarcity of resources along with physical and emotional overtiredness of health providers (4, 5).
Diagnostic criteria determination is one of the important factors in clinical investigations. It is vital to design accurate diagnostic and screening systems to minimize misdiagnosis and poor prognosis. Because of the novelty and complexity of COVID-19, our knowledge is increasing gradually based on the findings of numerous ongoing studies and clinical practice experiences; hence, the diagnostic criteria are also evolving (11, 12).
Accurate and innovative statistical approaches can reduce uncertainty and ambiguity by offering evidence-based medicine for risk analysis, screening, prediction, and care plans; they support reliable clinical decision-making and, hope to improve patient outcomes and quality of care (13). Using statistical approaches to analyze big datasets is essential for optimal prevention, screening, treatment, and tracing of COVID-19 (14-16); this reduces uncertainty and ambiguity by offering a diagnosis model for risk analysis, prediction, and care plans (16, 17). Also, it can contribute to identification of high-risk groups, early detection of disease, and adoption of effective treatment plans (13, 18). To that end, many studies have proved that statistical approaches can meet the requirements of data modeling classification; and it has become the standard method for modeling disease variables and features (16, 18, 19). Moreover, it is extremely important to develop an accurate diagnostic model which determines the prognosis; it must be able to prioritize COVID-19 patients based on diagnostic criteria and measures (20). Therefore, the purpose of this study was to develop a diagnostic model to improve disease detection and screening via statistical machine learning analysis of the most important criteria; our results could help physicians to detect infection in the early stage, and subsequently reduce the COVID-19 outbreak and mortality rate.
This hospital-based, retrospective, and applied study was designed in Taleghani hospital, which is a referral center for COVID-19 in Abadan, Iran. The vice chancellor for research of Abadan University of Medical Sciences approved the current study (ethical code: IR. ABADANUMS, REC. 1399-129). The study participants were 435 patients referred to Taleghani hospital for COVID-19 diagnosis and treatment; 35 cases were excluded from the study due to incomplete medical records. Information of 400 positive and 400 negative cases concerning 40 diagnostic criteria in the Electronic Medical Record (EMR) database had been recorded for more than six months (March–August 2020). The criteria were categorized into five classes including: 1- clinical manifestations, 2- basic data, 3- para-clinical indicators, 4- epidemiological data, and 5- medical history. Suspected cases were detected after clinical manifestations and exposure data evaluations; positive samples were confirmed through para-clinical measures.
Statistical Analysis
The IBM SPSS Statistics version 25.0 (Armonk, NY: IBM Corp., USA) was applied to analyze the data. First, by using the Phi and Cramer's V correlation coefficient, the association of each diagnostic criterion (independent variable) with the result of positive COVID-19 (dependent variable) was measured. Any variable with statistically significant correlation coefficient (P<0.05) with the output class variable (presence or absence of COVID-19) was considered as an effective diagnostic criterion for COVID-19. Then, the Enter method of binary logistic regression (BLR) technique was used to measure the odds ratio (OR) of each important variable (Exp (B) in this research) at p level. Finally, by using the Forward Wald method and investigating the resulted -2 log-likelihood, confusion matrix, and receiver operator characteristics (AUC) from it, the strength of these important diagnostic criteria was assessed in terms of OR to predict the COVID-19; the Two BLRs with 12 and six diagnostic criteria were compared and evaluated in terms of performance.
After excluding the missing data from the study, 400 samples with 40 features were used in this study. Among the participants, 250 (62.5%) cases belonged to COVID-19 infected individuals, (135 (54%) males and 115 (46%) females) and 150 (37.5%) cases belonged to non-infected subjects (71 (47%) males and 79 (53%) females).
The 40 existing diagnostic criteria in the EMR database were categorized into five classes including: 1- clinical manifestations, 2- para-clinical indicators, 3- epidemiological data, 4-demographic and basic data, and 5- history findings. The clinical manifestations were cough, fever, dyspnea, disability, loss of conscious, chest pain, throat pain, rhinorrhea, rhin-ophyma, headache, tremor, respiratory rate, digestive signs such as diarrhea, loss of taste sense and vomiting. The para-clinical findings were laboratory indicators, oxygen saturation (SPO2), pulmonary lesion, lesion distribution, lesion morphology, and lesion location. The demographic and baseline characteristics included age, sex, occupation, and body mass index (BMI). The exposure data included susceptible population, geogra-phical location, transmission mode, contact history, contact category, contact frequency, contact time, and recent travel. The personal and medical history included pregnancy status, alcohol consumption, tobacco use, taking Beta blocker and immune-suppressive drug, history of lung infection and previous acute respiratory distress syndrome (ARDS). The correlations of the most important diagnostic criteria with the output class, which have been obtained by Phi coefficient and Cramer's V coefficient test, are presented in Table1.
As Table 2 shows, 12 diagnostic criteria were considered as the most significant ones (P<0.001). The pulmonary lesion was considered as the most important criterion in COVID-19 diagnosis (with a Phi Crammer’s of 0.665 at P=0.01). Using the Enter method and after adding 12 variables, the BLR result demonstrated a true classification rate of 94%; in other words, in this phase, the regression model classified 409 out of 435 cases, correctly. Also, the -2 log-likelihood rate reduced from 325 (pre-step before adding variables) to 96 (by adding variables).
The OR of each diagnostic criterion (EXP (B)) has been demonstrated in Table 2, The OR of each diagnostic criterion (EXP (B)) , 95% confidence interval (CI) of Exp(B) at statistically significant level has been demonstrated in Table 2.
Table 1. The key diagnostic criteria at p level
| Approximate significance | Correlation coefficient | Features | Variable type | Definition | Variable name | No. |
| <0.001 | 0.665 | Have Do not have |
binominal | Single round, spot or oval growth in the lung | Lung lesion | 1 |
| 0.001 | 0.421 | Have Do not have |
binominal | Sudden and fast expulsion of air through the large breathing passages | Cough | 2 |
| <0.001 | 0.416 | Have Do not have |
binominal | Body temperature increase above the normal range | Fever | 3 |
| 0.001 | 0.405 | Have Do not have |
binominal | Uncomfortable and abnormal awareness of breathing | Dyspnea | 4 |
| 0.01 | 0.401 | >95% 85%-95% <85% |
Poly nominal | Low oxygen in the blood (hypoxemia) | Oxygen deficiency in blood | 5 |
| 0.02 | 0.336 | Have Do not have |
binominal | Gastrointestinal tract disorders | Digestive signs | 6 |
| 0.01 | 0.352 | Have Do not have |
binominal | Previous inflammatory lung condition that allows fluid to leak into the lungs and causes hypoxemia | History of ARDS | 7 |
| 0.01 | 0.289 | Have Do not have |
binominal | Previous exposure to infected people | Contact history | 8 |
| 0.01 | 0.17 | Have Do not have |
binominal | Any conditions (impairment) of the body or mind | Disability | 9 |
| 0.01 | 0.21 | Have do not have |
binominal | Previous infectious condition of the upper or lower respiratory tract. | History of pulmonary infection | 10 |
| 0.005 | 0.15 | <24 in minute >=24 in minute |
binominal | Breath number per minute | Respiratory rate | 11 |
| 0.001 | 0.135 | Have Do not have |
binominal | Mucous discharge from the nose | Rhinorrhea | 12 |
Table 2. The regression result by odds ratio at p level
| Significant difference | The 95% confidence of EXP (B) | EXP (B) | Variable name | No. |
| <0.001 | 5.8-17.3 | 10.3 | Lung lesion | 1 |
| <0.001 | 1-5-15 | 4.5 | Cough | 2 |
| <0.001 | 0.96-10 | 1.3 | Fever | 3 |
| 0.001 | 0.5-12.5 | 4.2 | Dyspnea | 4 |
| 0.08 | 0-1.5 | 0.6 | Oxygen deficiency in blood | 5 |
| 0. 2 | 0.72-7.83 | 2.38 | Digestive signs | 6 |
| <0.01 | 0.1-2 | 1.2 | History of ARDS | 7 |
| 0.01 | 0.75-9.5 | 3.5 | Contact history | 8 |
| 0.126 | 0.05-1.8 | 1.6 | Disability | 9 |
| 0.01 | 0.1-3.1 | 1.1 | History of pulmonary infection | 10 |
| 0.102 | 0-2.5 | 1.5 | Respiratory rate | 11 |
| 0.235 | 0.15-2.3 | 1.6 | Rhinorrhea | 12 |
Based on Table 2, lung lesion, cough, fever, dyspnea, contact history, and ARDS history acquired higher OR than other diagnostic criteria.
In the next step, the high ORs regression analysis variables were entered into the Forward Wald model in the six sequential steps to detect their diagnostic power for COVID-19 infection. The results of the -2 log-likelihood values for each step have been shown in Figure 1.
According to Figure 1, at first, by adding the pulmonary lesion criterion into the model, the -2 log-likelihood amount altered from 332/483 to 152/212; as a result, the efficiency of the regression model increased sharply. In the next step, a decreasing trend was seen in the rate of cited criterion, and consequently an increment was observed in the model efficiency. The amounts of True Positive (TP), False Positive (FP), False Negative (FN), and True Negative (TN) have been expressed by the confusion matrix in different steps (Table 2). On the other hand, by adding the lung lesion, cough, fever, dyspnea, contact history, and history of ARDS criteria, the regression model was able to predict the output class (existence or absence of the COVID-19) with a good classification rate close to the prior BLR with 12 criteria.
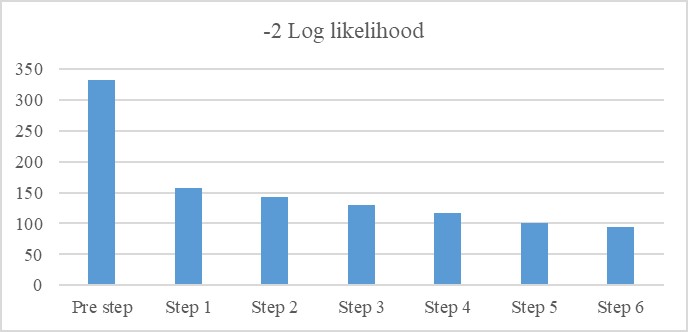
Figure 1. The comparison of the -2 Log-likelihood criterion
As Table 3 shows, before entering the variables into the study, the model classified all confirmed cases with the transverse classification method by default (pre-step), correctly; but all non-COVID-19 cases were misclassified, which were largely corrected in the next stages.
Table3. Comparison of the classification criteria
| TN | FN | FP | TP | BLR Statue | No. |
| 0 | 0 | 150 | 250 | Pre-Step | 1 |
| 102 | 55 | 48 | 195 | Step 1 | 2 |
| 135 | 22 | 15 | 228 | Step 6 | 3 |
The results of the traverse classification model showed a correct classification rate of 62.5%, by default. In the first step, by adding the pulmonary lesions criteria, the correct classification rate increased to 74.25%; finally, in the last step, after adding all six important diagnostic criteria, the correct classification of the model reached 90.25%. AUC diagram of the fitting study samples was drawn based on the regression model (Figure 2).

Figure 2. The AUC of the BLR
According to Figure 3, the AUC obtained 0.835 at P-value<0.001; the hypothesis which supports the inefficiency of the regression model based on these six criteria was rejected. As the result confirmed, the pulmonary lesion, fever, cough, dyspnea, contact history, and Gastrointestinal (GI) complications were introduced as effective factors for COVID-19 diagnosis. The performance of the two regression models was compared by the sample classification criteria in the two situations including 12 and six diagnostic criteria; the schematic picture has been shown in Figure 3.

Figure 3. Comparison of the two BLRs
Based on Figure 3 and comparing the two models in two situations, the number of correctly classified samples for TPs and TNs in the twelve variables of the BLR was 61.2% and 36.5%, respectively. When the six variables with the highest OR were entered to the BLR,, they decreased to 57.0% and 33.8%, respectively. On the other hand, the incorrectly classified samples including the FPs and FNs resulted from the 12 variables situation of the BLR were 1.0% and 1.3%, and in the six variables situation, they were obtained 3.7% and 5.5%, respectively.
Discussion
COVID-19 is a highly contagious viral infectious disease, which is spreading dramatically across the world (21-23). The virus affects the upper respiratory tract and causes very mild to severe manifestations such as rhinorrhea, cough, dyspnea, fever, tiredness, myalgia, and pneumonia-like condition. It is more dangerous in vulnerable people and those with underlying conditions (24-27). Many factors such as severe complications, long incubation period, nature uncertainty, and high infectivity have increased disease controlling challenges (28). To response the 2020 ongoing pandemic, many governments, health policymakers, and scientific communities across the world have suggested various innovative analytical techniques such as statistical and computational measures to identify the hidden aspects of the disease (29, 30). Therefore, due to vague and multidimensional nature of COVID-19, it seems necessary to identify the clinical aspects and prioritize them for disease risk analysis; these measures can contribute to recognize high-risk groups, detect the disease early, and adopt effective treatment plans (31, 32). Also, it is essential to identify and isolate the positive cases at the early stage of diagnosis rapidly and accurately, because it can help inhibit the transmission of the virus, especially for asymptomatic cases (2, 3, 33).
In the present study, the results of Phi and Cramer's V correlation coefficient showed that the presence of the signs and symptoms in people is an important criterion for accurate decision making. This study aimed to determine the diagnostic criteria to predict COVID-19. The six aforementioned criteria were selected according to the higher OR. Of all the variables (11 out of 12 variables, except the oxygen present in the blood), the pulmonary lesion with correlation coefficient of 0.479 at P-value<0.001 and a significant decrease in the -2 log-likelihood scale was the most powerful criterion. According to the Enter method of BLR, fever, cough, dyspnea, diarrhea, and contact history were other necessary criteria (they had a better OR).
A large number of studies and applications have shown that the statistical or computational methods for machine learning can meet the requirements to identify COVID-19 diagnostic criteria or features. Classification and prioritizing the manifestations and diagnostic variables of COVID-19 have become the standard approach for modeling the disease; it could help to design the diagnostic models and decision supporting tools. Some efforts have been focused on diagnostic criteria determination to identify and predict the disease based on statistical or computational techniques. Mohammed et al. (2020) suggested 12 diagnostic models to select the best optimal clinical criteria for COVID-19 by computational machine learning (SVM); finally, fever, cough, and fatigue were considered as the most important clinical symptoms (20). Mahmood et al. (2020) examined 4,659 records of the confirmed and suspected COVID-19 cases; they used statistical solutions to find related risk factors of the disease. Finally, the results showed that fever, dry cough, shortness of breath, and myalgia were COVID-19-related factors, which might have major roles in disease incidence (12).
The interpretation of results showed that the existence of pulmonary lesion (OR=10.3, 95% of OR CI=[3.8-17.5]), fever (OR=5.4, 95% of OR CI=[1-19.5]) and cough (OR=4.45, 95% of OR CI=[0.86-12.96]) were the three most important diagnostic criteria in COVID-19 diagnosis. Based on the findings of our study, there was a significant association between COVID-19 and these manifestations. On the other hand, respiratory infection history, rhinorrhea, and ARDS (OR=0.0 or close to 0) were not considered as important diagnostic criteria for COVID-19.
Limitations
The main limitation of this study was the size of the studied dataset. because of existing the records with information insufficiency in the dataset, we forced to remove many records for analyzing purposes, and therefore, the reduced size of the data set may affect the analyzing performance, to some extent.
In the future, it is recommended that to use the larger and multicenter dataset with quantitative data to investigate and analyze the diagnostic criteria and make the diagnostic model for COVID-19 more accurate with higher performance than current study.
Conclusion
The present study might help medical specialists to select the optimal diagnostic and screening tools, as well as effective triage for evidence-based decision making through identification and prioritizing diagnostic criteria. According to the different criteria such as upper limit of R2 and reducing -2 log-likelihood, BLR model evaluation showed that this model could predict the COVID-19 with a good performance at the sixth step. Also, performance evaluation of the Forward Wald BLR model by correctly classified samples trends and fitting result diagram using AUC showed that the obtained results were relatively satisfying; this process could be improved by testing new techniques in larger, multi-centric, and qualitative datasets. Moreover, through comparing the BLR in the two situations (12 and six variables), we witnessed a decreasing trend in the correctly classified samples and an increasing trend in incorrectly classified ones; this result was obtained by removing the less important diagnostic criteria in terms of OR (it was not a significant change). In other words, the BLR which used the six variables, had a good classification rate (90.25% at step 6); this model could predict the disease well.
Acknowledgements
The vice chancellor for research of Abadan University of Medical Sciences approved the current study (ethical code: IR. ABADANUMS, REC. 1399-129). All subjects signed an informed consent form before participating in the study. We thank the research deputy of Abadan faculty of medical sciences for financially supporting this project.
Conflicts of Interest
The authors declare that they have no conflicts of interest.
Received: 2020/08/9 | Accepted: 2020/09/30 | Published: 2020/12/30
| Rights and permissions | |
 |
This work is licensed under a Creative Commons Attribution-NonCommercial 4.0 International License. |
Copyright Policy
