


BibTeX | RIS | EndNote | Medlars | ProCite | Reference Manager | RefWorks
Send citation to:
URL: http://journal.zums.ac.ir/article-1-7039-en.html


2- Iranian Legal Medicine Research Center, Legal Medicine Organization, Tehran, Iran
3- Dept. of Biology, Sanandaj Branch, Islamic Azad University, Sanandaj, Iran ,
✅ The HRM technique was an accurate and inexpensive method for investigating the genetic differences between the four studied populations.
Y-chromosomal STRs (short tandem repeat) could provide clues to paternal pedigree studies. As such, most forensic interest is devoted to autosomal and Y-chromosomal STRs. Since the Y-chromosome is inherited from the father to all sons, it is natural for all sons to have the same STRs on their Y-chromosome in all generations. Therefore, by analyzing the Y-chromosome STRs, it is possible to determine the kinship between the men of the same a family, uncle-nephew pairs, brothers, etc. (1-4).
STR markers were first used in 1990 as a powerful tool in human identification tests. The Forensic Science Service initiated a study to identify new loci and the association between known loci and population diversity. Subsequently, the Royal Canadian Mounted Police (RCMP) along with some European laboratories, began their initial attempts and studies on STR loci. The first studied loci included TH01, VWA, FES/FPS, and F13A1. The second-generation multiplex (SGM) included TH01, VWA, FGA, D8S1179, D18S51, and D21S11 loci. In 1995, the UK National DNA Database (NDNAD) added the amylogenic gene locus to SGM. Building on STR typing technology and the success achieved in the UK, the FBI (Federal Bureau of Investigation) sought to use STR loci to form the basis of CODIS (combined DNA index system) (5).
The number of Y-STR markers used in forensic genetic research is on the rise. Initially, only nine loci were investigated (6) but later the Scientific Working Group on DNA Analysis Methods (SWGDAM) suggested that a larger number of markers be screened. As the number of markers increased, the identification accuracy also increased and resulted in reliable results (7). In 1992, Roewer et al. published a paper that examined short repetitive sequences (8). Also, in 1994, Misawa et al. published an article on the use of DNA polymorphisms in forensic genetics and added some points on the use of a specific Y-chromosome probe (9). In 1996, Roewer et al. performed analysis of molecular variance (AMOVA) on Y-chromosome specific microsatellites (10). In 1997, Kayser explained the role of the Y-chromosome in forensic genetics via a highly reliable article published in the International Journal of Legal Medicine. He also described the appropriate markers of this chromosome (11). From then on, many studies have been performed to obtain the best and most reliable results based on Y-chromosome STRs. For example, Perez-Lezaun et al. (1997) examined Y-chromosome STR markers and their frequency in the same year (12). In 2001, an international committee was set up to study markers, allelic frequency, and key parameters based on Y-chromosome STRs. Also, Gill et al. (2001) published an article in the International Journal of Legal Medicine (13). In addition, universities and identification institutions in different countries have published numerous articles about a wide range of populations. Since the capillary popularization of electrophoresis, information about STRs has increased dramatically. Accordingly, European, American, and East Asian countries have been able to use population-related data in genetic calculations of populations (14). In 2012, the populations of China (15), Libya (16), Brazil (17), and Korea (18) were surveyed. In 2013, a larger population of China (19) and in 2014 the population of Bangladesh (20) were surveyed. As of 2016, a large number of haplotypes have been published worldwide, and articles with approved data are accessible in the Y-STR Haplotype Reference Database (YHRD) (21). Similar research has been conducted in a number of Middle Eastern countries such as the United Arab Emirates (22), Pakistan (23), Afghanistan (24), Tajikistan, (25), and Turkey (26).
Research reports concerning Iranian context are not consistent, and various ethnicities in Iran have been reported in different research studies. Hence, it is not possible to access and compare them accurately. In most studies, data are only reported as frequency percentages and could not be compared with other data (27, 28). In addition, the widespread migration and increased rates of exogamy across all ethnic groups require periodic research to examine the value of markers used in forensic medicine and racial differentiation.
HRM (high resolution melting) technique is a method commonly used to determine Y-STR loci. In this method, the curves of each peaks represents the melting point of a PCR product, which is computed by measuring fluorescence changes at different temperatures. The melting curve (green) has a high fluorescence, which denotes the pre-melting stage. As the temperature increases and the two DNA strands break apart, the fluorescence decreases sharply. This decline continues until the DNA becomes single-stranded. HRM results are displayed on a panel of 48 samples separated by Tm (melting temperature) and variant. In fact, the melting temperature of each sample (i.e., when half of the two DNA strands break apart and become single-stranded) is different due to differences in alleles and hence nucleotides. The HRM technique classifies samples into different variants based on differences in melting points (Tm). Different variants cold be distinguished by the different colors in the diagrams, and each color represents a variant. Each color and thus each variant belongs to one of the locus alleles. Accordingly, this study aimed to examine and compare the diagnostic value of three Y-chromosome markers in racial studies by HRM method.
Sampling
This study was ethically approved by the Legal Medicine Research Center of the Legal Medicine Organization, Tehran, Iran (2.197/30.7.1396). Blood samples were taken randomly from 200 non-relative Kurdish volunteers residing in Kurdish cities of Iran (Kermanshah, Sanandaj, Sardasht, and Ilam) during 2017 to 2019. The samples were mainly collected from blood donors referring to the Blood Transfusion Organization, non-native Kurdish students residing in dormitories of Sanandaj universities, and rural residents.About 5 mL of male blood was collected using a 10 ml syringe and subsequently transferred into CBC (complete blood count) tubes containing EDTA. The samples were placed in a freezer at -20 °C until used in subsequent tests.
Molecular experiments
DNA extraction
KBCPrep™ Cell DNA Extraction Kit was used for DNA extraction, as per the manufacturer’s protocol. The kit includes a lysis solution, precipitation solution (isopropanol-base), protease buffer, wash buffer (ethanol-based), and a solvent buffer. To perform extraction, 100 µL of blood sample and 400 µL of lysis buffer were combined in a microtube and vortexed for 10 to 15 seconds. Afterward, 300 µL of precipitation solution was added into the microtube, vortexed for 5 seconds, and centrifuged at 12,000 g for 10 minutes. The supernatant was then discarded, and 1 ml of wash buffer was added into the microtubes vortexed for 2 to 3 seconds and centrifuged at 12,000 g for 5 minutes. The dried pellets were dissolved in 50 µL of a solvent buffer with gentle shaking and incubated at 65 °C for 5 min. The insoluble matter was precipitated via centrifugation for 30 seconds. The remaining supernatant was pure DNA. Subsequently, the quality of the extracted DNA samples was examined using horizontal electrophoresis on 1%agarose gel, and the quantity of each sample was checked with a NanoDrop. For this purpose, DNA samples were diluted at a ratio of 1 to 20. Then 100 μL of TE solution was used to blank the device. Next, light absorbance at 260 and 280 nm wavelengths was measured, and the absorption ratio (260/280) was determined for each sample. DNA sample with adsorption ratios between 1.8 and 2.2 were selected. DNA typing was performed for DNA samples at a concentration of 50 ng/µL.
Primers
Primer 3 online software was used to design primers. The primers were blasted and compared to STRs in the STR base DNA database (http://www.cstl.nist.gov/strbase). After ensuring their suitability for synthesis, they were transferred to Gene Transfer Pioneers (GTP) Company.
PCR and HRM technique
Real-time PCR (polymerase chain reaction) was performed on 48-well plates, three wells of which contained reference samples. The reaction was performed in a total reaction volume of 20 μL containing 1 μL of each primer, 50 ng of template DNA, 3 μL of MgCl2, 12 μL of doubl distilled water, and 3 μL of PCR Master Mix of HRM technique. The latter technique included Eva Green, a fluorescent green dye for nucleic acid that could bind to DNA, is spectrally very close to dyes such as FAM and SYBR® dye Green I, and is detectable at 488 nm. The amplification protocol consisted of an initial denaturation step at 95 °C for 12 minutes, 40 denaturation cycles at 95 °C for 15 seconds, an annealing cycle at 60 °C for 20 seconds, and an extension at 72 °C for 20 seconds. The HRM phase consisted of an initial denaturation at 95 C for 1 min followed by a renaturation phase at 43 °C for 1 min. Melting curves were produced by increasing the temperature level from 70 to 95 °C at a rate of 0.02 °C/s. During amplification, fluorescence data were normalized and subsequently plotted using the auto-grouping feature provided by Light Cycler 480 II gene scaning software. The curves of the samples were compared with each other and with normal (sequenced) samples to detect dissimilar cases.
Figures 1 and 2 present an example of the diagram of AC004617 and AC022486 loci, respectively. Also, Table 1 shows a lists of alleles based on the variables the HRM chart. Since reference samples with specific profiles were among the samples run for each locus before PCR, the allele sizes of the other samples were determined based on their placement in each variant (Table 1). In Figure 1, the derivative melt curve has two peaks, one is related to AC004617 (І) and the other is related to AC004617 (ІІ). In the other diagrams, nonetheless, the two peaks are merged and indicate the allele frequency corresponding to the AC004617 locus.
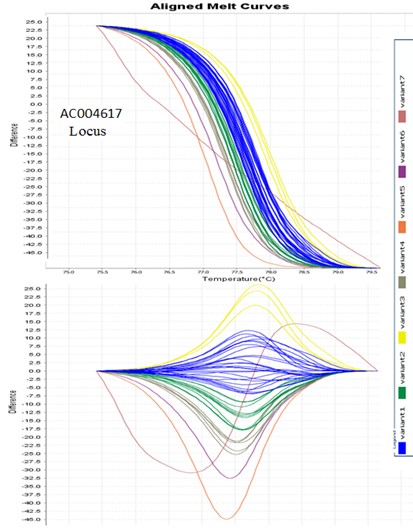
Figure 1. HRM diagram of locus AC004617. In the AC004617 loop, the derivative melt curve has two couriers, one courier corresponding to AC004617 (I) and the next courier of AC004617 (II), but in the other charts, the two couriers are merged and represent the allele frequency of the AC004617 locus.
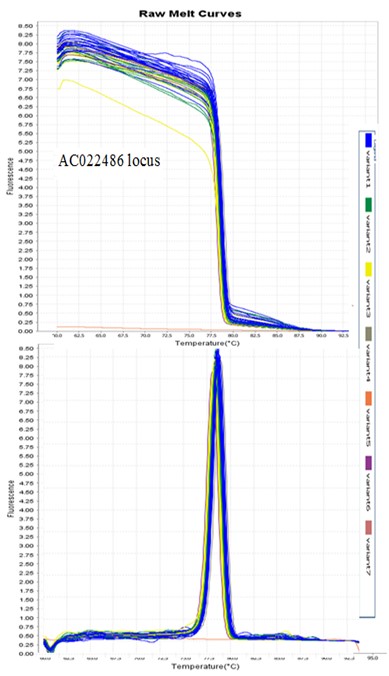
Figure 2. HRM diagram of locus AC022486.
Table 1. Alleles identified based on HRM chart variants
| Variant2 |
Variant1 |
Variant DYS Color in cure |
||||||
| 15 | 15 | 12 | 13 | 12 | 14 | 13 | Alleles | AC004617 (І) |
| 26 | 32 | 28 | 31 | 27 | 29 | 30 | AC004617 (ІІ) | |
| 11 | 16 | 14 | 17 | 15 | 13 | 12 |
AC022486 | |
The HRM findings showed that the majority of alleles were related to the AC022486 locus, and the lowest number of alleles were related to the AC004617 (І) locus. In all Kurdish cities, the highest allelic frequencies was related to allele 13 in locusAC004617 (І); allele 30 and 29 in locus AC004617 (ІІ), and allele 12 in locus AC022486. Also, allelic frequencies associated with AC022486, AC004617 (ІІ) and AC004617 (І) loci indicated high polymorphism in AC022486 and AC004617 (ІІ) loci. Table 2 summarizes the identified haplotypes in this study. Some of haplotypes with the proportions of 16, 15, 9, and 7 were found in Kermanshah, Sanandaj, Sardasht, and Ilam cities, respectively.
Table 2. Frequency distribution of Y-STR3 haplotypes in all Kurdish cities
| Ilam | Sardasht | Kermanshah | Sanandaj | N | AC022486 locus | AC004617 (ІІ) |
AC004617( I) | Haplotype |
| 0.13 | 0.05 | 0.00 | 0.00 | 3 | 12 | 27 | 12 | H1 |
| 0.00 | 0.00 | 0.00 | 0.03 | 1 | 15 | 27 | 12 | H2 |
| 0.00 | 0.05 | 0.03 | 0.00 | 2 | 16 | 27 | 12 | H3 |
| 0.07 | 0.00 | 0.03 | 0.00 | 2 | 15 | 28 | 12 | H4 |
| 0.00 | 0.00 | 0.00 | 0.03 | 1 | 12 | 31 | 12 | H5 |
| 0.00 | 0.00 | 0.00 | 0.03 | 1 | 16 | 31 | 12 | H6 |
| 0.00 | 0.00 | 0.03 | 0.00 | 1 | 14 | 30 | 13 | H7 |
| 0.00 | 0.00 | 0.03 | 0.03 | 8 | 15 | 30 | 13 | H8 |
| 0.4 | 0.3 | 0.07 | 0.24 | 12 | 12 | 31 | 13 | H9 |
| 0.2 | 0.1 | 0.07 | 0.07 | 9 | 13 | 30 | 13 | H10 |
| 0.00 | 0.00 | 0.00 | 0.03 | 2 | 11 | 30 | 13 | H11 |
| 0.00 | 0.15 | 0.2 | 0.1 | 14 | 12 | 13 | 13 | H12 |
| 0.00 | 0.00 | 0.07 | 0.1 | 5 | 16 | 30 | 13 | H13 |
| 0.07 | 0.20 | 0.07 | 0.07 | 1 | 15 | 29 | 13 | H14 |
| 0.00 | 0.05 | 0.00 | 0.03 | 1 | 13 | 29 | 13 | H15 |
| 0.00 | 0.00 | 0.03 | 0.00 | 2 | 15 | 29 | 13 | H16 |
| 0.07 | 0.05 | 0.13 | 0.00 | 5 | 13 | 29 | 14 | H17 |
| 0.00 | 0.05 | 0.07 | 0.07 | 6 | 12 | 29 | 14 | H18 |
| 0.07 | 0.00 | 0.03 | 0.07 | 4 | 15 | 29 | 14 | H19 |
| 0.00 | 0.00 | 0.07 | 0.03 | 3 | 16 | 29 | 14 | H20 |
| 0.00 | 0.00 | 0.00 | 0.03 | 1 | 17 | 29 | 14 | H21 |
| 0.00 | 0.00 | 0.03 | 0.00 | 1 | 12 | 26 | 15 | H22 |
| 0.00 | 0.00 | 0.03 | 0.00 | 1 | 12 | 32 | 15 | H23 |
Among the haplotypes, haplotypes 2, 5, 6, 7, 11, 16, 21 and 22 were specific for the cities (figure 3).
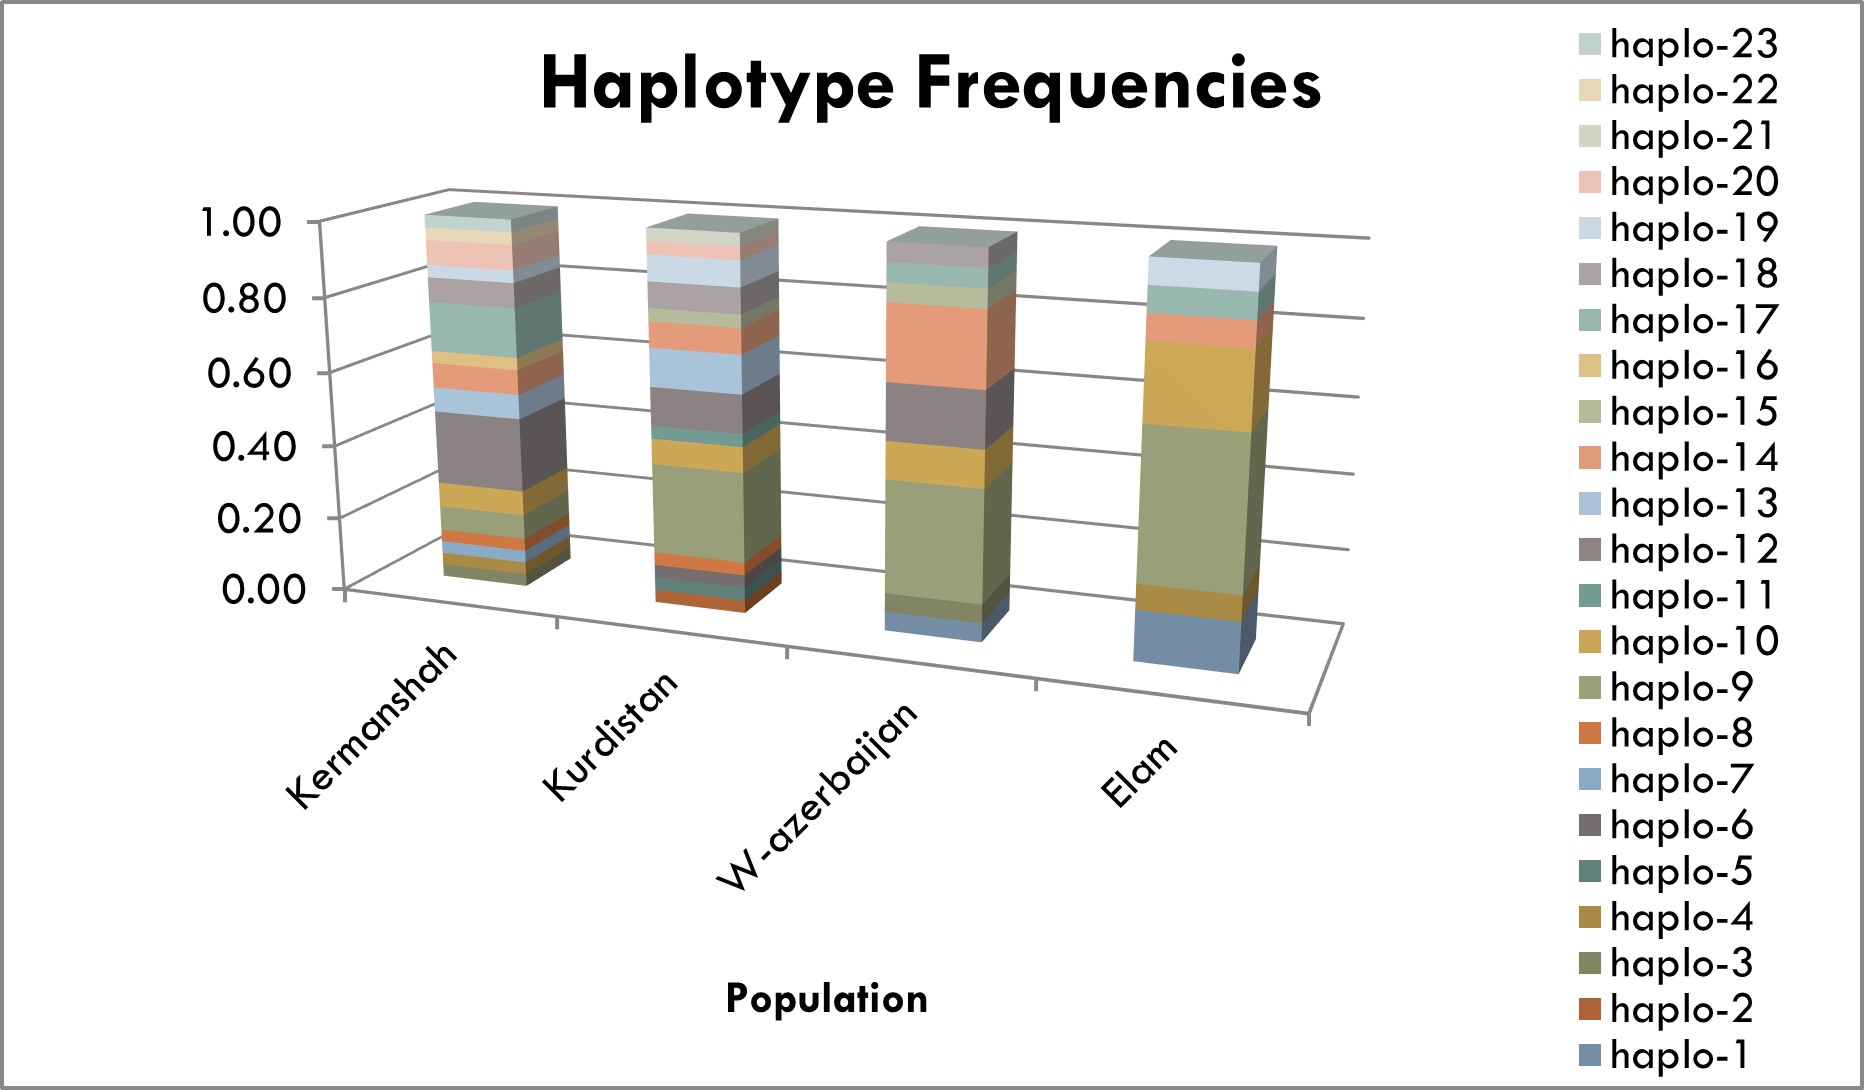
Figure 3. The numbers and abundance of haplotypes in Kermanshah, Kurdistan (Sanandaj), West Azarbaijan (Sardasht), Ilam cities
In Table 3 compares the genetic impact of the identified haplotypes on the studied populations. The mean N_e value for the four Kurdish cities was 7.742, the highest value was related to Kermanshah (11,006) and the lowest value was related to Ilam (4.053). Besides, H_e and R_h values were higher for Kermanshah than for the other cities.
Table 3. Comparison of the genetic impact of the identified haplotypes on the studied populations of Kermanshah, Sanandaj, Sardasht and Ilam provinces
| R_h | H_e | N_e | N | Population |
| 9.484 | 0.939 | 11.006 | 64 | Kermanshah |
| 9.032 | 0.913 | 9.899 | 63 | Sanandaj |
| 6.756 | 0.799 | 6.009 | 43 | Sardasht |
| 6.031 | 0.809 | 4.053 | 26 | Ilam |
| 7.825 | 0.864 | 7.742 | 50 | Mean |
N: Sample size in each population, N_e: Effective number of haplotypes, H_e: Genetic diversity
R_h: Haplotypic richness
Discussion
In this study, three STRs were evaluated in 200 individuals living in Kurdish cities of western Iran, including Kermanshah, Sanandaj, Sardasht, and Ilam .Allele and haplotype frequencies were compared between the studied populations. Afterward, allele and haplotype frequencies inIranian Kurds were compared with those in other Iranian populations and Kurdish populations of neighboring countries.
The results showed that in all four cities with Kurdish residents, most allelic replications in AC004617 (I), AC004617 (II), and AC022486 loci were related to alleles 13, 29 and 30, and 12, respectively. Studies have shown that in the Isfahan population, the highest allelic replication in AC004617 (І), AC004617 (ІІ) and AC022486 loci are associated with alleles 13, 29, and 12, respectively, indicating that these two populations differ in only one of the studied loci, namely locus AC004617 (ІІ) (27). Previous studies on STR loci in the population of Tehran have shown that the highest allelic replication are related to allele 13 in locus AC004617 (І), allele 30 in locus AC004617 (ІІ) and allele 12 in locus AC022486, which are similar to the results of this study (28). In the Kurdish population of Iraq, the most frequent allelic replications in AC004617 (І), AC004617 (ІІ) and AC022486 loci are related to alleles 13, 30, and 13, respectively (29). Also, in the population of Turkey, the highest frequency of alleles in AC004617 (І), AC004617 (ІІ) and AC022486 markers corresponds to alleles 13, 30, and 10, respectively (26).
By comparing the present study findings with those other studies, it was found that, the AC022486 locus had the highest score among the three studied loci for population differentiation. In a study conducted by Vatandoost (2017) on eight STR loci in the population of Isfahan, the AC022486 locus was appointed as polymorphism marker in forensic medicine with the maximum allelic frequency (27). In a study on STRs by Kareem et al. (2015), AC022486 was shown to have the highest polymorphism value compared to other loci (29). Similarly, in another study by Salimi et al. (2010) on haplotype and allele frequency in a random population of Tehrani men, the AC022486 locus had the highest polymorphism value (30).
In the current study some haplotypes were identified among the studied populations, haplotypes 2, 5, 6, 11, and 21 were found in Sanandaj city, while haplotypes 7, 16, and 22 were observed in Kermanshah. However, no specific haplotypes was identified in Sardasht and Ilam. As shown in Table 2, Kermanshah had the highest number of haplotypes and genetic diversity (Table 3) compared to the other Kurdish cities. The N_e level in all Kurdish cities was smaller than 0.25, which implies a slight difference but greater similarity between these populations.
Conclusion
The results were analyzed using the relevant software and showed that the AC022486 locus was potentially more beneficial as a population differentiation marker than the other studied markers. Also, the HRM technique was as an accurate and inexpensive method for investigating the genetic differences between the four studied populations.
Acknowledgements
None.
Funding
None.
Conflicts of Interest
The authors declare that there is no conflict of interest.
Authors' Contribution
All authors were equally involved in conducting the practical work, writing the article and revising it. Additionally, all authors have thoroughly reviewed and approved the final version.
Received: 2023/03/13 | Accepted: 2023/07/17 | Published: 2023/10/29
| Rights and permissions | |
 |
This work is licensed under a Creative Commons Attribution-NonCommercial 4.0 International License. |
Copyright Policy
