


BibTeX | RIS | EndNote | Medlars | ProCite | Reference Manager | RefWorks
Send citation to:
URL: http://journal.zums.ac.ir/article-1-6261-en.html


2- Social Determinants of Health Research Center, Kashan University of Medical Sciences, Kashan, Iran ,
3- Trauma Research Center, Kashan University of Medical Sciences, Kashan, Iran
4- Student Research Committee, Kashan University of Medical Sciences, Kashan, Iran
✅ According to our results, the exact doses of esmolol infusion significantly reduced the level of SBP during intubation, compared with bolus esmolol.
Patients undergoing coronary artery bypass grafting (CABG) are at risk of myocardial ischemia during the surgery. Due to the increase in the rate of oxygen consumption, tachycardia doubles the ischemic index. During CABG, some maneuvers such laryngoscopy and intubation may cause tachycardia and hypertension, in spite of a suitable level of anesthesia [1]. Hemodynamic changes followed by laryngoscopy and intubation are usually transient and asymptomatic. In patients with coro-nary artery disease (CAD), hypertension, or cerebrova-scular diseases, high blood pressure, and tachycardia may increase the risk of myocardial ischemia, arrhythmia, and even infarction and cerebral hemorrhage [2]. Attempts to block such responses include topical and systemic appli-cation of lidocaine, vasodilators, α- and β-blockers, Ang-iotensin converting enzyme inhibitors (ACE inhibitors), calcium channel blockers, and inhaled anesthetics [3]. Since tachycardia mostly contributes to myocardial ischemia rather than hypertension, using β-adrenergic antagonists is an effective method to reduce cardiac responses to laryngoscopy and intubation. Although reduction in hemodynamic responses to laryngoscopy and intubation is desired, direct negative inotropic and chronotropic effects of β-blocker receptors may reduce coronary perfusion and increase the risk of cardiac failure in high-risk patients [4]. Esmolol is a selective and water soluble β1-blocker, with no systematic or membrane stabilizing activities in therapeutic doses. The distribution and excretion half-life of esmolol are 2 and 9 minutes, respectively. Esmolol infusion and bolus esmolol prevent hemodynamic changes such as tachycardia and hyper-tension during laryngoscopy and tracheal intubation [5].
In a study, in patients undergoing CABG, 500 µg/kg/minute of esmolol infusion was compared with 1.5mg/kg bolus esmolol and the results indicated that esmolol infusion was more effective than the bolus esmolol in controlling systolic blood pressure (SBP) during tracheal intubation [6]. According to the mention-ed study, the most effective dose of esmolol in intubation was a 500 µg/kg/minute loading dose within 4 minutes, followed by 200 or 300 µg/kg/minute of infusion dose [7]. In another study, 0.4 mg/kg dose of esmolol prevented tachycardia and hypertension during laryngoscopy and intubation [8]. In a study, the administration of 2µg/kg bolus fentanyl, 2 minutes before laryngoscopy and intubation could not prevent HR elevation and blood pressure increase; while 2 mg/kg esmolol prevented the elevation of systolic and diastolic blood pressures as well as MAP following the tracheal intubation [9]. To the best of our knowledge, there was only one study on the effect of esmolol infusion and bolus esmolol to prevent hemodynamic complications following laryngoscopy and intubation in patients with CABG; the study administered high doses that were not affordable and were potentially harmful for the patients. Hence, the current study aimed at comparing 1.5 mg/kg bolus esmolol with 0.5 mg/kg continuous esmolol infusion in 4 minutes, followed by 200 µg/kg/minute esmolol infusion on the hemodynamic responses to laryngoscopy and intubation in the patients considered as candidates for elective CABG surgery.
Patients
A total of 112 patients classified as ASA (American Society of Anesthesiologists) II to IV with ejection fraction (EF) >40% considered as candidates for elective CABG at Shahid Beheshti Hospital, Kashan, Iran in 2016, were enrolled in the study. All patients with first-degree and higher atrioventricular (AV) blocks, asthma, HR <50, acute myocardial infarction (MI), Mallampati score >2, liver or renal failure, history of allergy or idiosyncratic reaction to β-blockers, SBP <100 mmHg and DBP <50 mmHg were excluded from the study.
Study groups: Patients were assigned into 3 groups by the permuted blocked randomization method (fig 1).
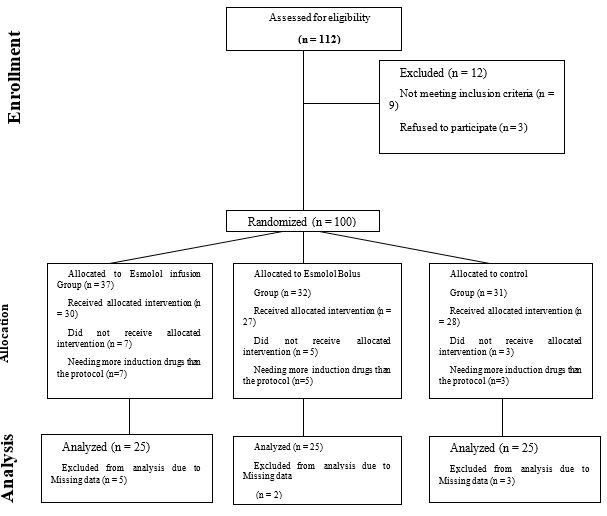
Figure1. Consort chart of the study
a) A total of 0.5 mg/kg esmolol was administered within 4 minutes and, then, the infusion was started with 200 µg/kg/minute and continued until tracheal intubation. A dose of 0.9% NaCl was administered 2 minutes prior to tracheal intubation (The infusion group).
b) Two minutes prior to tracheal intubation, patients received 1.5 mg/kg intravenous bolus esmolol; in addition, 10 minutes prior to tracheal intubation, 0.9% NaCl was administered (The bolus group).
c) Bolus normal saline, instead of esmolol, in addition to 0.9% NaCl was administered (The control group).
Sample size
In the current study sample size was calculated based on the systolic arterial pressure (SAP) changes during induction to sternotomy interval. According to Efe EM et.al study, means±SD of "SAP×TIME" in infusion and bolus groups were 2843±360 and 3297±548 respectively [6]. Given the confidence of 95% and power of 90%, minimum sample size was calculated as 22 in each group of study.
Study procedure
After obtaining ethical approval from our local institutional review board (IRB), Ethical code: IR.KAUMS.REC.1394.19; date: 24 May, 2015, and registering at the Iranian Registry of Clinical Trial (IRCT20200822048478N2), the study subjects were randomly assigned into 3 groups after signing the written informed consent. After entering the operating room, all patients were monitored by pulse oximetry, electro-cardiogram, and non-invasive blood pressure measuring device. After establishing an intravenous (IV) line access with a 16-gauge catheter, infusion of 0.9% normal saline was commenced. In the next step, 0.04 mg/kg midazolam was administered. To monitor invasive blood pressure, following the local infiltration with lidocaine an intra-arterial catheter was placed in the radial artery of non- dominant hand. Accordingly, 3 minutes after the induction of general anesthesia with 0.3 mg/kg etomidate, 5 µg/kg fentanyl, and 0.2 mg/kg atracurium, the patients were intubated by a single anesthesiologist. The anes-thesia was maintained by the infusion of 5 µg/kg/hour fentanyl, 1 µg/kg/minute midazolam, and 8 µg/kg/minute atracurium. Patients were ventilated with 50% air/oxygen mixture and 0.5 MAC isoflurane. Esmolol was provided by Claris Company (India). Ten minutes prior to laryngoscopy, HR, DBP, SBP, and MAP were recorded; accordingly, all measures were continuo-usly recorded during and after the induction of anesthesia, during laryngoscopy, and during and after the tracheal intubation every minute for 10 minutes. To blind the study, the treatment procedures were performed by a specialist and vital signs were recorded by the anesthesia technician who was blinded to the study. Primary outcomes in our study included Systolic, diastolic, mean arterial pressures and heart rate, and secondary outcomes included possible complications of each treatment method, which fortune-ately was not observed in any of the groups.
Statistical analysis
After data collection, the normality of data was evaluated by the Kolmogorov- Smirnov test. The SBP, DBP, MAP and HR of the patients were measured at different intervals and then, the groups were compared using the Chi-square test and one-way ANOVA; for multiple comparisons Tukey's Post Hoc Test was applied. Finally, the effect of therapeutic methods during the time was analyzed using repeated measures ANOVA [10, 11].
A total of 75 patients (25 subjects in the infusion, 25 in the bolus esmolol, and 25 in the control groups) undergoing CABG surgery were evaluated; out of whom 24 (32%) subjects were male. The mean ± SD of age of the patients was 60.6±9.9 years within the age range of 39 to 84 years. All of the study groups were matched for gender and no significant difference was observed among the groups regarding patients’ age (P=0.61). No signi-ficant difference was observed among the groups regard-ing weight, height, BMI, and EF (P >0.16) (Table 1).
Table 1. Demographic and clinical characteristics of patients who underwent CABG
| variables | Study groups | P.value | |||
|---|---|---|---|---|---|
| Infusion | Bolus | Control | |||
| Sex(male) | 8(32) | 8(32) | 8(32) | N.S3 | |
| Age(year) | ≤59 | 9(36) | 10(40) | 11(44) | 0.61 |
| 60-69 | 10(40) | 13(52) | 10(40) | ||
| ≥70 | 6(24) | 2(8) | 4(16) | ||
| ±SD | 62.3±11.2 | 59.9±9.1 | 59.6±9.3 | 0.572 | |
| Weight | 74.4±11.9 | 72.3±9.6 | 72.01±3.9 | 0.758 | |
| Height | 166.1±8.8 | 160.1±20.9 | 167.4±7.7 | 0.16 | |
| BMI1 | 27.04±4.3 | 33.3±4.9 | 25.5±3.9 | 0.346 | |
| EF2 | 54.8±7.1 | 54.2±5.7 | 55.4±6.1 | 0.801 | |
Abbreviations: 1 Body Mass Index, 2 Ejection Fraction, 3 not significant
Table 2 illustrates the changes in HR, SBP, DBP, and MAP in the study groups, from 10 minutes prior to laryngoscopy to 10 minutes after intubation. The HR was at lowest in the infusion group from the time of tracheal intubation to 6 minutes after the intubation (Figure 1).The mean SBP at time 1 was higher in the infusion group, compared to the other groups, although no significant difference was observed among the groups (P=0.449), the difference was significant at time 4 (see caption of the table 4[01] ) (P= 0.029).The levels of SBP in the infusion, bolus, and control groups were 103.1, 107.1, and 113.3 mmHg, respectively at time 4. The primary difference in DBP among the groups was significant; however, the difference was resolved at the time of intubation, but the difference in MAP and HR changes among the study groups was not significant (P >0.05).
The results of the current study indicated that the changes in all variables were significant based on time (P <0.001), in addition, the interaction between time and study groups on SBP, MAP, and HR changes was significant (P <0.05) (Table 3).
Table 2. Means and standard deviations of SBP, DBP, MAP and HR in study groups over time
| Study groups | Infusion | Bolus | control | P.value | |
|---|---|---|---|---|---|
| ±SD | x ̅±SD | x ̅±SD | |||
| HR | T0 | 74.8±13.3 | 80.7±13.3 | 77.3±14.6 | 0.327 |
| T1 | 65.2±11.3 | 67.1±9.5 | 69.7±14.6 | 0.414 | |
| T2 | 64.1±10.3 | 64.04±9.07 | 66.6±11.9 | 0.625 | |
| T3 | 64.9±13.7 | 65.8±11.1 | 68.9±15.9 | 0.557 | |
| T4 | 65.9±11.7 | 70.6±11.1 | 70.0±11.5 | 0.29 | |
| T5 | 62.2±12.5 | 63.1±9.4 | 63.1±10.2 | 0.941 | |
| systolic | T0 | 129.8±16.2 | 127.4±19.1 | 126.8±22.8 | 0.449 |
| T1 | 107.1±19.5 | 104.5±18.4 | 110.5±23.5 | 0.589 | |
| T2 | 98.7±22.1 | 100.3±22.01 | 104.2±26.8 | 0.104 | |
| T3 | 103.1±10.56 | 107.1±12.9 | 113.3±18.2 | 0.029 | |
| T4 | 119.2±18.5 | 123.04±22.8 | 125.6±21.8 | 0.26 | |
| T5 | 106.0±14.9 | 109.4±14.1 | 110.9±15.5 | 0.487 | |
| Diastolic | T0 | 73.03±6.8 | 74.1±5.4 | 71.5±7.5 | 0.041 |
| T1 | 63.01±13.5 | 63.2±10.4 | 62.9±14.3 | 0.995 | |
| T2 | 57.72±14.3 | 60.8±12.9 | 59.96±15.5 | 0.73 | |
| T3 | 61.04±14.2 | 65.5±15.5 | 66.5±19.7 | 0.27 | |
| T4 | 70.8±11.3 | 74.2±12.7 | 74.2±12.7 | 0.533 | |
| T5 | 62.5±10.3 | 65.2±6.6 | 64.4±10.8 | 0.575 | |
| MAP | T0 | 95.8±12.9 | 95.2±12.8 | 92.7±15.3 | 0.701 |
| T1 | 80.1±15.5 | 79.8±12.4 | 81.7±16.4 | 0.895 | |
| T2 | 73.8±17.1 | 77.4±17.5 | 78.2±18.8 | 0.654 | |
| T3 | 78.8±16.8 | 84.1±18.7 | 86.04±22.7 | 0.409 | |
| T4 | 89.4±14.3 | 93.8±16.6 | 93.3±16.8 | 0.572 | |
| T5 | 78.4±10.8 | 83.2±7.9 | 82.3±12.7 | 0.242 | |
T0: Mean of hemodynamic parameters 10 to 4 minutes before laryngoscopy
T1: Mean of hemodynamic parameters 3 minutes to just prior to the laryngoscopy
T2: Hemodynamic parameters during laryngoscopy
T3: Hemodynamic parameters during intubation
T4: Mean of hemodynamic parameters from immediately after intubation to 3 minutes later
T5 Mean of hemodynamic parameters from 4 to 10 minutes after intubation
The level of SBP was rather high in the infusion group 3 minutes prior to laryngoscopy, but it decreased in the infusion and bolus groups, compared with the controls. It is noteworthy that the level of SBP in the experimental group was lower than that of the control group at any time points (Figure 2) and DBP changes were also similar to those of SBP. For better explanation, 3 minutes before laryngoscopy the SBP level was higher in the infusion and bolus groups, compared with the control group; however, it was at the lowest in the infusion group from the initiation of laryngoscopy to 6 minutes after tracheal intubation (Figure 2).
Table3. Analysis of variation of SBP, DBP, MAP and HR based on the effect of groups and group*time
| Outcome avariables | Sources of variations | Sum of Square | DF | Mean of Square | F | Sig. |
| Systolic | Time | 31514.4 | 2.207 | 14279.6 | 52.95 | <0.001 |
| Time*group | 2873 | 4.414 | 650.9 | 2.4 | 0.045 | |
| diastolic | Time | 7461 | 2.28 | 3333.8 | 26.86 | <0.001 |
| Time*group | 492.6 | 4.476 | 110 | 0.887 | 0.482 | |
| MAP | Time | 2205.8 | 1 | 2205.8 | 16.52 | <0.001 |
| Time*group | 994 | 2 | 497 | 3.72 | 0.029 | |
| HR | Time | 1434.4 | 1 | 1434.45 | 22.58 | <0.001 |
| Time*group | 450.6 | 2 | 225.34 | 3.54 | 0.034 |

Figure 2. Means of Systolic and Diastolic blood pressures, MAP and heart rate at different times from 10 minutes before laryngoscopy to 10 minutes after intubation
The significant effect of time indicates the changes of dependent variable over time. The significant effect of (time x groups) interaction indicates the significant difference among the groups over time. In other words, HR, SBP, and MAP changes were not similar in the study groups at different intervals. Tukey's HSD post hoc test showed significant differences between the infusion and control groups (P <0.05), but the differ-ence was not significant between the infusion and bolus groups (P >0.05); also between bolus and control groups (P >0.05). It means that esmolol infusion more successfully controlled HR and blood pressure than bolus esmolol.
It also should be noted that no complications were observed in any of the treatment groups during the study period (data are not shown).
Discussion
Direct laryngoscopy is usually associated with hemodynamic stress responses which in turn increases the risk of perioperative myocardial ischemia espe-cially in CABG [12-15]. According to the results of the current study, lower doses of esmolol infusion prevent the elevation of SBP, DBP, MAP, and HR in patients considered as candidates for elective CABG surgery. Besides, the level of hemodynamic changes was lower in the esmolol infusion group, compared with the bolus esmolol group; however, no significant difference was observed between the groups. The difference in hemo-dynamic changes was significant between the esmolol infusion and the control groups. In a study by Mercanooglu, 500 µg/kg/minute esmolol infusions was compared with 1.5 mg/kg bolus esmolol, the results showed that the esmolol infusion was more effective than bolus esmolol in the maintenance of SBP during tracheal intubation [6]. In a study by Figueredo, the loading dose of 500 µg/kg/minute within 4 minutes followed by 200 to 300 µg/kg/minute was the most effective dose of esmolol [7]. Benskey showed that the small doses of esmolol (0.4 mg/kg) may inhibit HR and blood pressure elevations following laryngoscopy and intubation [8]. According to the results of a study by Hussain, the administration of 2 µg/kg bolus fentanyl 2 minutes prior to laryngoscopy and intubation failed to prevent HR and SBP elevation; while, 2 mg/kg esmolol controlled HR elevation, but failed to prevent the elevation of arterial blood pressure [9]. Gogus N et al., (2013) compared the effects of 1 µg/kg dexmed-etomidine infusion with 2 µg/kg fentanyl and 2 mg/kg esmolol on hemodynamic response to laryngoscopy and intubation. They concluded that dexmedetomidine was superior in the prevention of tachycardia while Esmolol could prevent systolic, diastolic and mean arterial pressure increases following intubation [16]. In another study, 2 mg/kg bolus esmolol inhibited the elevation of HR following laryngoscopy and intubation [17]. Results of a study showed that a combination of 30 µg/kg nicardipine + 1 mg/kg esmolol could maintain the level of blood pressure after laryngoscopy and intubation, compared with other tested drug. Nevertheless, no drug solely or in combination with other drugs controlled HR elevation [18]. In a study by Tan, a combination of 1 mg/kg esmolol + 30 µg/kg nicardipine made no significant changes on the level of SBP following the intubation [19]. In a study on the comparison of 3µg/kg alfentanil, 1 mg/kg esmolol, and 3 µg/kg clonidine, results indicated that none of the studied drugs could block the elevation of MAP following the tracheal intubation, although esmolol had better results on hemodynamic maintenance [20]. In a study by Ugur, administration of 1.5 mg/kg esmolol 2 minutes prior to intubation inhibited tachycardia and RPP (rate pressure product) elevation [21]. A comparison of 2 mg/kg lidocaine, 3 µg/kg fentanyl, and 2 mg/kg esmolol showed that only esmolol could reliably inhibit the elevation of HR and SBP following the intubation; fentanyl prevented the hypertension following the intubation, but failed to stop tachycardia, and lidocaine was ineffective on hemodynamic respo-nses following the laryngoscopy and intubation [22].
In the current study, lower doses of esmolol infusion were used; however, the aforementioned studies reported similar results using higher doses. There was no need to control hypotension, bradycardia, or arrhythmia in the current study; in addition, no side effect was reported in the studied subjects. Hence, it can be concluded that using lower doses of esmolol infusion is low-risk and cost-effective, besides, it might be effective on hemodynamic complications following laryngoscopy and intubation.
Conclusion
According to the results of the current study, the applied doses of esmolol infusion significantly reduced SBP during intubation. Hemodynamic changes were significant over time; in addition, SBP, MAP, and HR changes were not significant in the infusion group, compared with the controls, but there was no signi-ficant difference between the esmolol infusion and bolus esmolol groups. In conclusion, to control hemod-ynamic changes, esmolol infusion in lower doses can be applied.
Acknowledgements
The manuscript was part of a research project approved by Kashan University of Medical Sciences and the local ethical committee (Code No. ir.Kaums.rec.1394.19; date: 24 May, 2015).
Conflicts of Interest
None.
Received: 2020/10/13 | Accepted: 2021/05/25 | Published: 2022/01/31
| Rights and permissions | |
 |
This work is licensed under a Creative Commons Attribution-NonCommercial 4.0 International License. |
Copyright Policy
