
Wed, Sep 9, 2026
[Archive]
Volume 34, Issue 2 (March & April 2026)
J Adv Med Biomed Res 2026, 34(2): 146-155 |
Back to browse issues page



Download citation:
BibTeX | RIS | EndNote | Medlars | ProCite | Reference Manager | RefWorks
Send citation to:


BibTeX | RIS | EndNote | Medlars | ProCite | Reference Manager | RefWorks
Send citation to:
Sahar Algburi H A, Deylami A, Musavi H, Mokhtari H, Masoumi Qajari N, Lotfi Asrami F et al . Correlation of PSA Levels with Inflammatory and Hematological Biomarkers for Differential Diagnosis of Prostate Cancer and Benign Prostatic Hyperplasia. J Adv Med Biomed Res 2026; 34 (2) :146-155
URL: http://journal.zums.ac.ir/article-1-7832-en.html
URL: http://journal.zums.ac.ir/article-1-7832-en.html
Hayder Ahmed Sahar Algburi1 

 , Ahmad Deylami2 , Hadis Musavi1 , Hossein Mokhtari3 , Neda Masoumi Qajari4 , Fatemeh Lotfi Asrami5 , Abbas Khonakdar *6
, Ahmad Deylami2 , Hadis Musavi1 , Hossein Mokhtari3 , Neda Masoumi Qajari4 , Fatemeh Lotfi Asrami5 , Abbas Khonakdar *6
1- Department of Clinical Biochemistry and Genetics, Faculty of Medicine, Mazandaran University of Medical Sciences, Sari, Iran
2- Department of Urology, School of Medicine, Mazandaran University of Medical Sciences
3- Amol Faculty of Paramedicine, Mazandaran University of Medical Sciences, Sari, Iran
4- Department of Genetic biology, Tonekabon Islamic Azad University, Tonekabon, Iran
5- Department of Biochemistry, Biophysics, Genetics and Nutrition, School of Medicine, Golestan University of Medical Sciences, Iran
6- Department of Clinical Biochemistry and Genetics, Faculty of Medicine, Mazandaran University of Medical Sciences, Sari, Iran & Pharmaceutical Sciences Research Center, Faculty of Pharmacy, Mazandaran University of Medical
2- Department of Urology, School of Medicine, Mazandaran University of Medical Sciences
3- Amol Faculty of Paramedicine, Mazandaran University of Medical Sciences, Sari, Iran
4- Department of Genetic biology, Tonekabon Islamic Azad University, Tonekabon, Iran
5- Department of Biochemistry, Biophysics, Genetics and Nutrition, School of Medicine, Golestan University of Medical Sciences, Iran
6- Department of Clinical Biochemistry and Genetics, Faculty of Medicine, Mazandaran University of Medical Sciences, Sari, Iran & Pharmaceutical Sciences Research Center, Faculty of Pharmacy, Mazandaran University of Medical
Full-Text [PDF 552 kb]
(144 Downloads)
| Abstract (HTML) (743 Views)
Full-Text: (2 Views)
ABSTRACT
Background & Objective: Differentiating prostate cancer (PC) from benign prostatic hyperplasia (BPH) remains clinically challenging due to overlapping symptoms and biomarker alterations. This study compared biochemical, hematological, and inflammatory markers between the two conditions to assess their potential diagnostic value.
Materials & Methods: A cross-sectional study was performed on 40 patients with PC and 120 patients with benign prostatic hyperplasia. The measurement of biochemical parameters included complete blood count, C-reactive protein (CRP), erythrocyte sedimentation rate (ESR), and total and free prostate-specific antigen (PSA). The process involved statistical comparisons, ROC analysis, and correlation tests.
Results: Compared to BPH, patients with PC had significantly higher PSA (free and total), CRP, and lymphocyte counts (all p < 0.05). Despite the diagnostic utility of PSA and inflammatory markers (AUCs 0.68–0.80), hematological parameters in isolation were not strong discriminators (AUCs < 0.50), and a combined biomarker strategy would be more effective in clinical discrimination.
Conclusion: Detection of PC from BPH can be more accurately achieved by assessing elevated free and total PSA levels, along with increased systemic inflammation, as indicated by CRP. The independent discriminant value of hematologic parameters is limited despite significant differences between groups. A combination of PSA and inflammatory markers in a two-biomarker strategy can improve clinical discrimination and reduce inappropriate therapy.
Keywords: C-reactive protein (CRP), Erythrocyte sedimentation rate (ESR), Neutrophil-to-lymphocyte ratio (NLR), Platelet-to-lymphocyte ratio (PLR), Prostate-specific antigen (PSA), Benign prostatic hyperplasia, Prostate cancer
Table 1. Comparison of Biochemical and Hematological Indices
.JPG)
Note: Creatinine (Cr), White Blood Cell count (WBC), Red Blood Cell count (RBC), Hemoglobin (HB), Hematocrit (HCT), Mean Corpuscular Volume (MCV), Mean Corpuscular Hemoglobin (MCH), Mean Corpuscular Hemoglobin Concentration (MCHC), Neutrophil count (Neut), Lymphocyte count (Lymph), Monocyte count (MON), Eosinophil count (EOS), Basophil count (BAS), Red Cell Distribution Width (RDW), Mean Platelet Volume (MPV), Platelet count (PLT), Erythrocyte Sedimentation Rate (ESR), Lymphocyte-to-Monocyte Ratio (LMR), Neutrophil-to-Lymphocyte Ratio (NLR), Platelet-to-Lymphocyte Ratio (PLR), Hemoglobin to Platelet Ratio (HPR), Free Prostate-Specific Antigen (fPSA), Total Prostate-Specific Antigen (tPSA), Free-to-Total PSA Ratio (PSA ratio).
.JPG)
3.3 The ROC analysis of laboratory indices for differentiating PC from BPH
According to Figure 1 (A through G), the AUC values for RBC, Hb, neutrophils (Neu), and NLR are all below 0.50, indicating that these variables have limited ability to distinguish PC from BPH. However, the markers fPSA, tPSA, and lymphocytes (Lymph) demonstrate acceptable and relatively good discriminatory power, with AUCs of 0.804, 0.760, and 0.679, respectively.
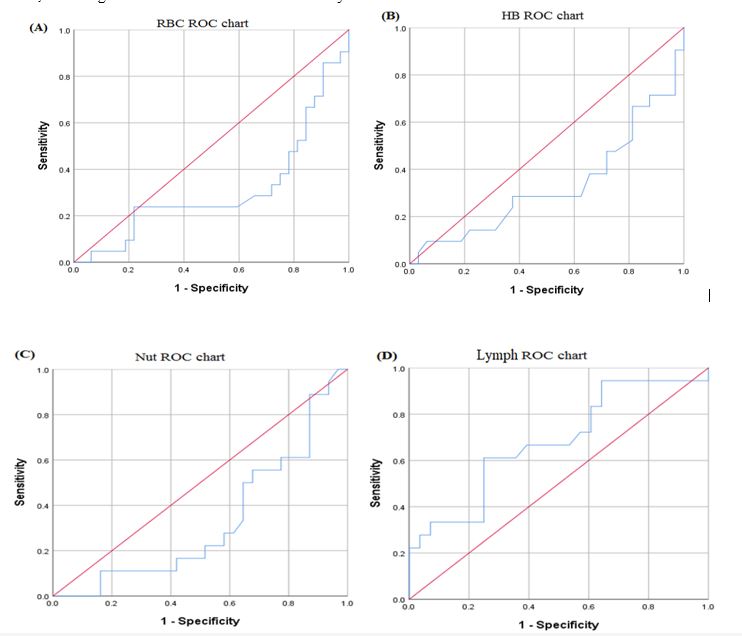
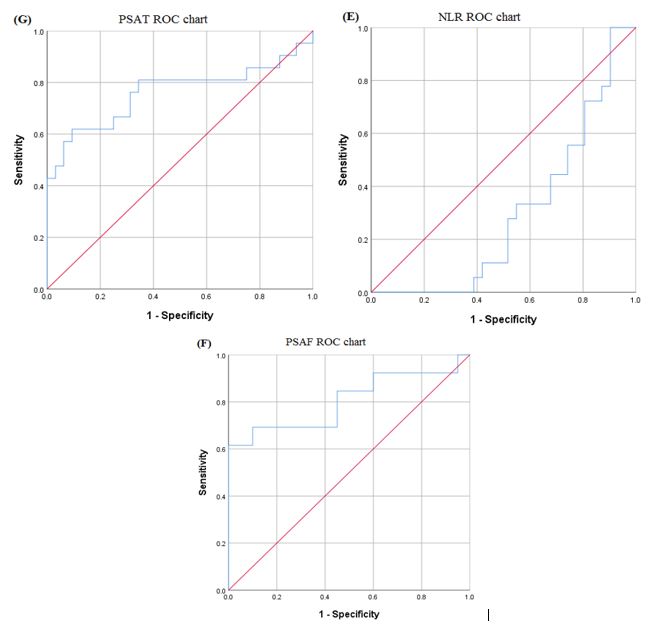
Figure 1. (A–G): ROC analysis of the diagnostic performance of laboratory indices for differentiating PC from BPH. (Prepared by Authors, 2026).
3.4 Correlation between free PSA (fPSA), Total PSA (tPSA), and Free PSA ratio with other biochemical and hematological parameters
The correlation analysis indicated that fPSA has a significant and moderately negative correlation with monocyte count (r = –0.532, p = 0.002), and has a highly positive correlation with PLR (r = 0.718, p < 0.001). ESR was also moderately correlated with fPSA (r = 0.457, p = 0.037). tPSA showed significant correlations with several hematological and biochemical parameters. Specifically, tPSA correlated positively with uric acid (r = 0.294, p = 0.033), RDW (r = 0.465, p = 0.001), and ESR (r = 0.462, p = 0.005). Conversely, it correlated negatively with Hb (r = –0.389, p = 0.004), HCT (r = –0.347, p = 0.011), and MCHC (r = –0.400, p = 0.003). The correlation between red cell distribution width (RDW) and ESR was moderately positive with total PSA (tPSA). However, this association should be stated explicitly (e.g., “tPSA was moderately positively correlated with RDW and ESR”), as currently phrased it is unclear. The fPSA/tPSA ratio was also found to be positively correlated with creatinine (r = 0.585, p = 0.001) and basophils but inversely correlated with RBC (r = –0.414, p = 0.021) and RDW, as shown in Table 3.
Table 3. The correlation of fPSA, tPSA, and the fPSA/tPSA ratio with various Biochemical and Hematological Variables in the Studied Patients.
.JPG)
Note: Creatinine (Cr), White Blood Cell count (WBC), Red Blood Cell count (RBC), Hemoglobin (HB), Hematocrit (HCT), Mean Corpuscular Volume (MCV), Mean Corpuscular Hemoglobin (MCH), Mean Corpuscular Hemoglobin Concentration (MCHC), Neutrophil count (Neut), Lymphocyte count (Lymph), Monocyte count (MON), Eosinophil count (EOS), Basophil count (BAS), Red Cell Distribution Width (RDW), Mean Platelet Volume (MPV), Platelet count (PLT), Erythrocyte Sedimentation Rate (ESR), Lymphocyte-to-Monocyte Ratio (LMR), Neutrophil-to-Lymphocyte Ratio (NLR), Platelet-to-Lymphocyte Ratio (PLR), Hemoglobin to Platelet Ratio (HPR), Free Prostate-Specific Antigen (fPSA), Total Prostate-Specific Antigen (tPSA), Free-to-Total PSA Ratio (PSA ratio).
3.5 Comparison of mean PSA values across different CRP levels
As shown in Table 4, both free PSA (fPSA) and total PSA (tPSA) levels varied significantly across different CRP groups (p = 0.004 and p = 0.025, respectively), indicating a significant association between systemic inflammation and elevated PSA. The highest mean values for both fPSA (8.09 ± 8.55 ng/mL) and tPSA (75.50 ± 101.31 ng/mL) were observed in the group with the highest CRP level (CRP 3+).
In contrast, the free-to-total PSA ratio did not differ significantly among the CRP groups (p = 0.408).
Table 4. Comparison of mean PSA values in different CRP levels
.JPG)
Background & Objective: Differentiating prostate cancer (PC) from benign prostatic hyperplasia (BPH) remains clinically challenging due to overlapping symptoms and biomarker alterations. This study compared biochemical, hematological, and inflammatory markers between the two conditions to assess their potential diagnostic value.
Materials & Methods: A cross-sectional study was performed on 40 patients with PC and 120 patients with benign prostatic hyperplasia. The measurement of biochemical parameters included complete blood count, C-reactive protein (CRP), erythrocyte sedimentation rate (ESR), and total and free prostate-specific antigen (PSA). The process involved statistical comparisons, ROC analysis, and correlation tests.
Results: Compared to BPH, patients with PC had significantly higher PSA (free and total), CRP, and lymphocyte counts (all p < 0.05). Despite the diagnostic utility of PSA and inflammatory markers (AUCs 0.68–0.80), hematological parameters in isolation were not strong discriminators (AUCs < 0.50), and a combined biomarker strategy would be more effective in clinical discrimination.
Conclusion: Detection of PC from BPH can be more accurately achieved by assessing elevated free and total PSA levels, along with increased systemic inflammation, as indicated by CRP. The independent discriminant value of hematologic parameters is limited despite significant differences between groups. A combination of PSA and inflammatory markers in a two-biomarker strategy can improve clinical discrimination and reduce inappropriate therapy.
Keywords: C-reactive protein (CRP), Erythrocyte sedimentation rate (ESR), Neutrophil-to-lymphocyte ratio (NLR), Platelet-to-lymphocyte ratio (PLR), Prostate-specific antigen (PSA), Benign prostatic hyperplasia, Prostate cancer
1. Introduction
BPH is a common urinary tract illness in older men and has a strong association with their age (1). According to international statistics, more than 50% of men over 50 experience some form of BPH, and the percentage increases to over 80% among elderly men (2).
Prostatic hyperplasia is characterized by the non-malignant and non-invasive growth of prostate cells that leads to an enlarged prostate and a variety of urinary symptoms. The symptoms listed include frequent urination, urgency, reduced urinary flow, hesitancy, nocturia, incomplete emptying of the bladder, and urinary retention and hematuria. The quality of life of patients is significantly affected by these symptoms; and they may develop into more severe complications.
Diagnosis of BPH is largely made on the basis of careful patient history, clinical examination, and specialized investigations (3).
Consequently, one of the easiest and most useful techniques for assessing the size and consistency of the prostate and detecting an abnormal mass or firmness that could suggest the presence of cancer is digital rectal examination (DRE) (4). Moreover, PSA testing is one of the most prevalent and valuable laboratory tests that measure the PSA level in the blood (5). PSA, a protein produced by prostate cells, can be elevated in numerous prostate disorders, including BPH and PC. The primary drawback of the PSA test is that an elevated level alone cannot exclude hyperplasia, as both hyperplasia and PC can raise the level of PSA (6, 7). While the PSA test has a high sensitivity for detecting PC (around 97%), its specificity is low, resulting in possible overuse of biopsies that are not necessary (5, 8). Combining PSA testing with digital rectal examination (DRE) can improve diagnostic performance, providing modest increases in both sensitivity and specificity (9).
The use of PSA testing and digital rectal examination (DRE) can improve diagnostic performance, leading to modest increases in both sensitivity and specificity (3). Despite these investigations, the gold standard for definitive differentiation between benign hyperplasia and cancer of the prostate remains a prostate biopsy followed by histopathological examination of the tissue specimens. Biopsy is an invasive procedure in which small tissue samples are excised to confirm or exclude the presence of cancerous cells (10).
Despite the diagnostic value of prostate biopsies, they can still produce minor bleeding, discomfort, infection, and occasionally serious complications like urinary retention and sepsis (11). Consequently, these complications have a negative impact on patients and significantly increase the expenses of healthcare systems (3). The involvement of systemic inflammation in the pathogenesis of prostate disease is increasingly supported by growing evidence.
The incorporation of inflammatory biomarkers, such as CRP, ESR, and complete blood count (CBC)-based indices, such as NLR and PLR, into diagnostic procedures is a growing trend. These markers are affordable, non-invasive, and widely available.
They work by reflecting the host inflammatory process, which is thought to impact both benign and malignant prostate diseases (12-14). Researchers suggest that using PSA in conjunction with inflammatory markers can enhance discrimination between PC and BPH, particularly when expensive imaging or biopsy facilities are not feasible (15, 16).
Nevertheless, a clinically reliable, non-invasive technique for precise differentiation between benign prostatic hyperplasia and PC has yet to be established. Consequently, further research is warranted to refine the use of existing biomarkers for accurate diagnosis and clinical guidance.
The purpose of this research is to investigate the association between free and total PSA levels and inflammatory markers, including CRP and ESR, and biochemical parameters (urea, creatinine, uric acid, and CBC indices) to improve the diagnosis of BPH and PC.
2. Materials and Methods
2.1 Sampling Method and Population Study
This cross-sectional survey targeted a population of males aged ≥50 years, given their increased risk for prostate conditions, including BPH and PC.
A total of 160 male patients diagnosed with prostate disease were recruited, comprising 120 with BPH and 40 with PC. This age threshold was chosen because of epidemiological evidence showing a significant increase in PC rates among men over the age of 50.
The common screening for PC in men in this age group makes them an appropriate and accessible population for study. The patients were recruited through urology clinics and specialist hospitals in Sari, Iran.
Study participants were obligated to have documented urinary symptoms like frequency, urgency, nocturia, weak urinary stream, or delayed urination.
They had a PSA test done, and a diagnosis of BPH or PC was made through clinical and imaging evaluations. Participants were selected from this approach, which gave all eligible individuals an equal chance of selection. The method was chosen because it decreases selection bias and increases the representativeness of the sample.
We included men who were suspected of having BPH or PC and had a prostate biopsy based on assessment through PSA, transrectal ultrasound, and digital rectal examination.
Patients who had diseases that could affect the results, such as liver disease (hepatopathies) and coagulation disorders, active inflammatory or autoimmune diseases, cardiovascular or cerebrovascular disease, symptomatic prostatitis, urinary tract infections, systemic inflammatory diseases, or anti-inflammatory medication use in the last two weeks before sampling were excluded.
A total of 40 age-matched healthy control subjects without a history or symptoms of prostate disease and 160 patients were recruited. These controls were age-matched with the patient group.
Before definitive biopsy confirmation, the cancer patients had been diagnosed radiologically and clinically. Venous blood was drawn from all participants after at least eight hours of fasting.
Blood was collected into anticoagulant tubes, and serum was separated for biochemical and inflammatory marker analyses. Pre-test precautions included requesting participants to avoid strenuous exercise, digital rectal exam, and ejaculation for 48 to 72 hours before blood draws and any prostate biopsy operations in an effort to minimize variability.
2.2 Laboratory investigations
The levels of both total PSA (tPSA) and free PSA (fPSA) were determined through immunoassay techniques, in accordance with the manufacturer’s instructions. Serum CRP was assayed using a CRP-LATEX Diako kit, and ESR was assessed by the Westergren method. Biochemical parameters such as urea, creatinine, and uric acid were analyzed on an automatic chemistry analyzer. Hematologic assessment was performed using a complete blood count (CBC), including RBC, Hb, HCT, WBC, neutrophils, lymphocytes, monocytes, and platelets. Systemic inflammatory markers like NLR, PLR, and LMR were calculated based on these counts. Under controlled laboratory conditions and rigorous quality control procedures, laboratory analyses were performed in a centralized clinical laboratory.
2.2 Statistical analysis
Data were analyzed using SPSS or R software and are presented as mean ± SD. Group comparisons were performed using independent t-tests or ANOVA, depending on the data distribution and the number of groups. Correlations of total and free PSA with biochemical and inflammatory markers were evaluated using Pearson or Spearman coefficients.
Multivariate models were used, where applicable, to adjust for potential confounders. Statistical significance was set at p < 0.05.
3. Result
3.1 Comparison of Biochemical and Haematological Indices
Table 1 presents a comparison of means between the study groups. The BPH group had significantly higher levels of RBC (p = 0.021) and Hb (p = 0.040) compared with the PC group.
In the BPH group, the mean neutrophil count increased significantly (p = 0.046), while in the PC group, the mean lymphocyte count increased significantly (p = 0.043).
Additionally, the NLR in the BPH group was significantly more elevated than in the PC group (p = 0.019). Finally, the levels of both fPSA (p = 0.004) and tPSA (p = 0.001) were significantly higher in the PC group.
Prostatic hyperplasia is characterized by the non-malignant and non-invasive growth of prostate cells that leads to an enlarged prostate and a variety of urinary symptoms. The symptoms listed include frequent urination, urgency, reduced urinary flow, hesitancy, nocturia, incomplete emptying of the bladder, and urinary retention and hematuria. The quality of life of patients is significantly affected by these symptoms; and they may develop into more severe complications.
Diagnosis of BPH is largely made on the basis of careful patient history, clinical examination, and specialized investigations (3).
Consequently, one of the easiest and most useful techniques for assessing the size and consistency of the prostate and detecting an abnormal mass or firmness that could suggest the presence of cancer is digital rectal examination (DRE) (4). Moreover, PSA testing is one of the most prevalent and valuable laboratory tests that measure the PSA level in the blood (5). PSA, a protein produced by prostate cells, can be elevated in numerous prostate disorders, including BPH and PC. The primary drawback of the PSA test is that an elevated level alone cannot exclude hyperplasia, as both hyperplasia and PC can raise the level of PSA (6, 7). While the PSA test has a high sensitivity for detecting PC (around 97%), its specificity is low, resulting in possible overuse of biopsies that are not necessary (5, 8). Combining PSA testing with digital rectal examination (DRE) can improve diagnostic performance, providing modest increases in both sensitivity and specificity (9).
The use of PSA testing and digital rectal examination (DRE) can improve diagnostic performance, leading to modest increases in both sensitivity and specificity (3). Despite these investigations, the gold standard for definitive differentiation between benign hyperplasia and cancer of the prostate remains a prostate biopsy followed by histopathological examination of the tissue specimens. Biopsy is an invasive procedure in which small tissue samples are excised to confirm or exclude the presence of cancerous cells (10).
Despite the diagnostic value of prostate biopsies, they can still produce minor bleeding, discomfort, infection, and occasionally serious complications like urinary retention and sepsis (11). Consequently, these complications have a negative impact on patients and significantly increase the expenses of healthcare systems (3). The involvement of systemic inflammation in the pathogenesis of prostate disease is increasingly supported by growing evidence.
The incorporation of inflammatory biomarkers, such as CRP, ESR, and complete blood count (CBC)-based indices, such as NLR and PLR, into diagnostic procedures is a growing trend. These markers are affordable, non-invasive, and widely available.
They work by reflecting the host inflammatory process, which is thought to impact both benign and malignant prostate diseases (12-14). Researchers suggest that using PSA in conjunction with inflammatory markers can enhance discrimination between PC and BPH, particularly when expensive imaging or biopsy facilities are not feasible (15, 16).
Nevertheless, a clinically reliable, non-invasive technique for precise differentiation between benign prostatic hyperplasia and PC has yet to be established. Consequently, further research is warranted to refine the use of existing biomarkers for accurate diagnosis and clinical guidance.
The purpose of this research is to investigate the association between free and total PSA levels and inflammatory markers, including CRP and ESR, and biochemical parameters (urea, creatinine, uric acid, and CBC indices) to improve the diagnosis of BPH and PC.
2. Materials and Methods
2.1 Sampling Method and Population Study
This cross-sectional survey targeted a population of males aged ≥50 years, given their increased risk for prostate conditions, including BPH and PC.
A total of 160 male patients diagnosed with prostate disease were recruited, comprising 120 with BPH and 40 with PC. This age threshold was chosen because of epidemiological evidence showing a significant increase in PC rates among men over the age of 50.
The common screening for PC in men in this age group makes them an appropriate and accessible population for study. The patients were recruited through urology clinics and specialist hospitals in Sari, Iran.
Study participants were obligated to have documented urinary symptoms like frequency, urgency, nocturia, weak urinary stream, or delayed urination.
They had a PSA test done, and a diagnosis of BPH or PC was made through clinical and imaging evaluations. Participants were selected from this approach, which gave all eligible individuals an equal chance of selection. The method was chosen because it decreases selection bias and increases the representativeness of the sample.
We included men who were suspected of having BPH or PC and had a prostate biopsy based on assessment through PSA, transrectal ultrasound, and digital rectal examination.
Patients who had diseases that could affect the results, such as liver disease (hepatopathies) and coagulation disorders, active inflammatory or autoimmune diseases, cardiovascular or cerebrovascular disease, symptomatic prostatitis, urinary tract infections, systemic inflammatory diseases, or anti-inflammatory medication use in the last two weeks before sampling were excluded.
A total of 40 age-matched healthy control subjects without a history or symptoms of prostate disease and 160 patients were recruited. These controls were age-matched with the patient group.
Before definitive biopsy confirmation, the cancer patients had been diagnosed radiologically and clinically. Venous blood was drawn from all participants after at least eight hours of fasting.
Blood was collected into anticoagulant tubes, and serum was separated for biochemical and inflammatory marker analyses. Pre-test precautions included requesting participants to avoid strenuous exercise, digital rectal exam, and ejaculation for 48 to 72 hours before blood draws and any prostate biopsy operations in an effort to minimize variability.
2.2 Laboratory investigations
The levels of both total PSA (tPSA) and free PSA (fPSA) were determined through immunoassay techniques, in accordance with the manufacturer’s instructions. Serum CRP was assayed using a CRP-LATEX Diako kit, and ESR was assessed by the Westergren method. Biochemical parameters such as urea, creatinine, and uric acid were analyzed on an automatic chemistry analyzer. Hematologic assessment was performed using a complete blood count (CBC), including RBC, Hb, HCT, WBC, neutrophils, lymphocytes, monocytes, and platelets. Systemic inflammatory markers like NLR, PLR, and LMR were calculated based on these counts. Under controlled laboratory conditions and rigorous quality control procedures, laboratory analyses were performed in a centralized clinical laboratory.
2.2 Statistical analysis
Data were analyzed using SPSS or R software and are presented as mean ± SD. Group comparisons were performed using independent t-tests or ANOVA, depending on the data distribution and the number of groups. Correlations of total and free PSA with biochemical and inflammatory markers were evaluated using Pearson or Spearman coefficients.
Multivariate models were used, where applicable, to adjust for potential confounders. Statistical significance was set at p < 0.05.
3. Result
3.1 Comparison of Biochemical and Haematological Indices
Table 1 presents a comparison of means between the study groups. The BPH group had significantly higher levels of RBC (p = 0.021) and Hb (p = 0.040) compared with the PC group.
In the BPH group, the mean neutrophil count increased significantly (p = 0.046), while in the PC group, the mean lymphocyte count increased significantly (p = 0.043).
Additionally, the NLR in the BPH group was significantly more elevated than in the PC group (p = 0.019). Finally, the levels of both fPSA (p = 0.004) and tPSA (p = 0.001) were significantly higher in the PC group.
Table 1. Comparison of Biochemical and Hematological Indices
Note: Creatinine (Cr), White Blood Cell count (WBC), Red Blood Cell count (RBC), Hemoglobin (HB), Hematocrit (HCT), Mean Corpuscular Volume (MCV), Mean Corpuscular Hemoglobin (MCH), Mean Corpuscular Hemoglobin Concentration (MCHC), Neutrophil count (Neut), Lymphocyte count (Lymph), Monocyte count (MON), Eosinophil count (EOS), Basophil count (BAS), Red Cell Distribution Width (RDW), Mean Platelet Volume (MPV), Platelet count (PLT), Erythrocyte Sedimentation Rate (ESR), Lymphocyte-to-Monocyte Ratio (LMR), Neutrophil-to-Lymphocyte Ratio (NLR), Platelet-to-Lymphocyte Ratio (PLR), Hemoglobin to Platelet Ratio (HPR), Free Prostate-Specific Antigen (fPSA), Total Prostate-Specific Antigen (tPSA), Free-to-Total PSA Ratio (PSA ratio).
3.2 Frequency Distribution of CRP Levels in PC and BPH Groups
Table 2 shows the qualitative distribution of CRP levels between the two patient groups. The results indicate that 70% of PC patients had a CRP level of 3, whereas only
3.4% of BPH patients had the same level. In contrast, most of the BPH patients presented with CRP levels 1 (43.3%) and 2 (53.3%).
This difference in the distribution of CRP levels between the two groups was statistically significant (p < 0.001).
Table 2. Frequency distribution of CRP Levels in PC and BPH GroupsTable 2 shows the qualitative distribution of CRP levels between the two patient groups. The results indicate that 70% of PC patients had a CRP level of 3, whereas only
3.4% of BPH patients had the same level. In contrast, most of the BPH patients presented with CRP levels 1 (43.3%) and 2 (53.3%).
This difference in the distribution of CRP levels between the two groups was statistically significant (p < 0.001).
3.3 The ROC analysis of laboratory indices for differentiating PC from BPH
According to Figure 1 (A through G), the AUC values for RBC, Hb, neutrophils (Neu), and NLR are all below 0.50, indicating that these variables have limited ability to distinguish PC from BPH. However, the markers fPSA, tPSA, and lymphocytes (Lymph) demonstrate acceptable and relatively good discriminatory power, with AUCs of 0.804, 0.760, and 0.679, respectively.
Figure 1. (A–G): ROC analysis of the diagnostic performance of laboratory indices for differentiating PC from BPH. (Prepared by Authors, 2026).
3.4 Correlation between free PSA (fPSA), Total PSA (tPSA), and Free PSA ratio with other biochemical and hematological parameters
The correlation analysis indicated that fPSA has a significant and moderately negative correlation with monocyte count (r = –0.532, p = 0.002), and has a highly positive correlation with PLR (r = 0.718, p < 0.001). ESR was also moderately correlated with fPSA (r = 0.457, p = 0.037). tPSA showed significant correlations with several hematological and biochemical parameters. Specifically, tPSA correlated positively with uric acid (r = 0.294, p = 0.033), RDW (r = 0.465, p = 0.001), and ESR (r = 0.462, p = 0.005). Conversely, it correlated negatively with Hb (r = –0.389, p = 0.004), HCT (r = –0.347, p = 0.011), and MCHC (r = –0.400, p = 0.003). The correlation between red cell distribution width (RDW) and ESR was moderately positive with total PSA (tPSA). However, this association should be stated explicitly (e.g., “tPSA was moderately positively correlated with RDW and ESR”), as currently phrased it is unclear. The fPSA/tPSA ratio was also found to be positively correlated with creatinine (r = 0.585, p = 0.001) and basophils but inversely correlated with RBC (r = –0.414, p = 0.021) and RDW, as shown in Table 3.
Table 3. The correlation of fPSA, tPSA, and the fPSA/tPSA ratio with various Biochemical and Hematological Variables in the Studied Patients.
Note: Creatinine (Cr), White Blood Cell count (WBC), Red Blood Cell count (RBC), Hemoglobin (HB), Hematocrit (HCT), Mean Corpuscular Volume (MCV), Mean Corpuscular Hemoglobin (MCH), Mean Corpuscular Hemoglobin Concentration (MCHC), Neutrophil count (Neut), Lymphocyte count (Lymph), Monocyte count (MON), Eosinophil count (EOS), Basophil count (BAS), Red Cell Distribution Width (RDW), Mean Platelet Volume (MPV), Platelet count (PLT), Erythrocyte Sedimentation Rate (ESR), Lymphocyte-to-Monocyte Ratio (LMR), Neutrophil-to-Lymphocyte Ratio (NLR), Platelet-to-Lymphocyte Ratio (PLR), Hemoglobin to Platelet Ratio (HPR), Free Prostate-Specific Antigen (fPSA), Total Prostate-Specific Antigen (tPSA), Free-to-Total PSA Ratio (PSA ratio).
3.5 Comparison of mean PSA values across different CRP levels
As shown in Table 4, both free PSA (fPSA) and total PSA (tPSA) levels varied significantly across different CRP groups (p = 0.004 and p = 0.025, respectively), indicating a significant association between systemic inflammation and elevated PSA. The highest mean values for both fPSA (8.09 ± 8.55 ng/mL) and tPSA (75.50 ± 101.31 ng/mL) were observed in the group with the highest CRP level (CRP 3+).
In contrast, the free-to-total PSA ratio did not differ significantly among the CRP groups (p = 0.408).
Table 4. Comparison of mean PSA values in different CRP levels
4. Discussion
Prostate pathologies, including BPH and prostate cancer, constitute a major public health concern for the aging male population globally (17). Both conditions exhibit a syndromic presentation, featuring overlapping signs and symptoms related to urinary dysfunction, which complicates the process of achieving an early and accurate diagnosis (3). Quantification of prostate-specific antigen (PSA) is the cornerstone diagnostic biomarker (18); Its specificity, however, is reduced because both BPH and prostate cancer are associated with elevated PSA (19). Furthermore, systemic inflammation and altered hematological indices have been identified as potential contributory factors or manifestations of prostate pathology. This supports the hypothesis that a broader biomarker landscape will improve diagnosis (16). This study aimed to identify biochemical and hematological profiles that separate PC from BPH in men aged >50 years, utilizing measures of PSA parameters, inflammatory markers, and blood cell indices. Our findings indicate significant distinctions between PC and BPH patients across several parameters. As expected, tPSA and fPSA were significantly higher in the PC cases, validating their established role as diagnostic markers. As expected from the literature, fPSA and tPSA showed relatively high discriminatory power in ROC analysis (AUC = 0.804 and 0.760, respectively), particularly fPSA for separating malignant from benign disease. Consistent with our findings, Bing-Zi Zou et al. reported tPSA and fPSA as accurate predictors of PC (AUCs = 0.820 and 0.867, respectively) (20).However, the PSA ratio did not differ appreciably between groups in our population, reflecting the heterogeneous diagnostic utility documented in another research. This contradicts another study by Azizul Islam et al., which found that the free-to-total PSA ratio was more diagnostic (91.67%) than tPSA (61.65%) in the 4–10 ng/mL PSA range (21). Hematologically, the PC subjects had lower RBC levels and hemoglobin (Hb) concentrations compared with BPH patients, very likely due to anemia of cancer and chronic disease states or bone marrow involvement. This is consistent with the finding of Coradduzza et al., who identified Hb as one of the key diagnostic parameters for PC, along with PSA, age, and others (22). Interestingly, neutrophil levels were higher in BPH, while lymphocyte levels were higher in PC cases, resulting in a significantly lower neutrophil-to-lymphocyte ratio (NLR) in the cancer group. This is in contrast to previous studies where high NLR was associated with cancer progression, suggesting that the diagnostic value of NLR may be influenced by patient population or disease stage. Mukhiya et al., for example, found no significant difference between the PC and BPH groups in NLR (p = 0.150) or PLR (p = 0.070) (12), while Shi et al. reported that PLR and SII are significantly correlated with BPH risk (13). Patients with PC had significantly increased systemic inflammation as reflected by high CRP levels; Seventy percent of PC patients had CRP 3+ levels, compared with only 3.4 % of patients with BPH. This is consistent with the growing evidence that tumor-related inflammation is a cause of carcinogenesis and may be used as an additional biomarker. However, findings in the literature are inconsistent. Ayyildiz et al. reported no significant difference in CRP between the PC and BPH groups (p = 0.779) (20), whereas YA Mensah-Bonsu et al. found that CRP was significantly increased in patients with PC (14). Conversely, increased CRP levels were reported in BPH patients compared to healthy controls, with heterogeneity reported in studies (15). In addition, recent publications have explored in more detail the diagnostic potential of inflammation and hematological markers (e.g., Guo and colleagues). They concluded that PSA, neutrophils (NEU), monocytes, CRP and NLR were significantly elevated in patients with PC and are valuable diagnostic indicators (16, 23). Mehta et al. also demonstrated that higher NLR (>3.44) and PLR (>165.96) were strong discriminators for PC (24). Yun et al. reported that PSA was positively correlated with neutrophil counts, NLR, PLR, and erythrocyte sedimentation rate (ESR), but not with CRP or lymphocyte counts (25). Our correlation study also showed that fPSA was negatively correlated with monocytes (r = –0.532, p = 0.002). However, the PLR was strongly correlated with fPSA (r = 0.718, p < 0.001) and the uric acid was weakly correlated with tPSA (r = 0.294, p = 0.033) and moderately correlated with ESR. The role of inflammatory markers in disease progression was further confirmed in a retrospective study, which showed that NLR, PLR, and red cell distribution width (RDW) were significantly higher in patients with PC and correlated with aggressive disease markers (26). Elevated CRP in PC may be a contributor to tumor growth, as meta-analytic data show (27), while the occasional finding of lower NLR in some cancer patients indicates heterogeneity in the population (28). These findings reveal the complexity of the systemic immune mechanisms and of prostate diseases (29). Although this research provides robust conclusions, a few caveats should be borne in mind. The relatively small size of the sample, especially for the PC group, may compromise the generalizability of the results. Using a larger cohort would increase statistical power and reduce selection bias. Moreover, the cross-sectional design of the study does not allow causal inference, as longitudinal research on changes in biomarkers over time can better define their role in diagnosis and prognosis. Another limitation is the lack of histopathological stratification as the study did not classify patients with PC according to Gleason score or disease stage, which may have an impact on the hematological and inflammatory profile. Future studies should include tumor aggressiveness as a major variable in the analyses.
Moreover, as a single-center study, the study may have geographical or demographic biases, which could be avoided by working together in more than one center. The PSA, CRP, and NLR panels in this study were limited and did not include other recently developed markers such as interleukin-6, prostate health index (PHI), and exosome-derived markers which may provide additional diagnostic utility.
In order to overcome these limitations, future studies must prioritize prospective, multicenter studies with long-term follow-up to ensure the diagnostic and prognostic usefulness of the biomarkers identified.
The extension of the scope to include advanced biomarkers such as cDNA, microRNAs, and inflammatory cytokines may further increase the accuracy of the diagnosis. The use of machine learning algorithms to develop predictive models based on clinical, hematologic, and inflammatory markers may also improve PC detection and risk stratification. In addition, stratification of patients by stage and by Gleason score may reveal diagnostic or prognostic signs specific to a particular stage.
The inclusion of healthy age-matched controls would help to distinguish between age- and disease-specific changes. Finally, experimental studies could evaluate whether these observed inflammatory changes, such as increased CRP, are a cause of PC progression or a secondary effect.
5. Conclusion
This study revealed significant biochemical and hematological differences between patients with PC and BPH, and highlighted the diagnostic utility of PSA parameters in the presence of inflammatory markers. Both total and free PSA levels were significantly higher in PC, which reaffirms the role of PSA as a first-line diagnostic biomarker. In addition, inflammatory indices such as CRP showed a strong correlation with malignancy, suggesting that systemic inflammation plays a central role in the pathophysiology of PC and may improve diagnostic specificity when combined with PSA testing.
6. Declarations
6.1 Acknowledgments
The authors express their sincere gratitude to the patients who participated in this study.
We also extend our thanks to the staff and personnel of the respective clinical and laboratory departments at Mazandaran University of Medical Sciences for their invaluable assistance in data and sample collection.
6.2 Ethical Considerations
The study protocol was reviewed and approved by the Ethics Committee of Mazandaran University of Medical Sciences (Approval Code: IR.MAZUMS.REC.1404.123), and written informed consent was obtained from all participants in accordance with the principles of the Declaration of Helsinki.
6.3 Authors' Contributions
H.A.S.A.: Conceptualization, Data curation, Formal analysis, Writing – original draft.
H.M.: Investigation, Methodology, Data curation.
H.M. (Hossein Mokhtari): Software, Validation, Formal analysis.
N.M.Q.: Investigation, Resources.
F.L.A.: Writing – review & editing.
A.K.: Supervision, Project administration, Writing – review & editing.
A.D.: Supervision, Conceptualization, Resources.
All authors reviewed and approved the final version of the manuscript.
6.4 Conflict of Interest
The authors declare that they have no conflict of interest.
6.5 Fund or Financial Support
None
6.6 Using Artificial Intelligence Tools (AI Tools)
The authors were not utilized AI Tools.
Prostate pathologies, including BPH and prostate cancer, constitute a major public health concern for the aging male population globally (17). Both conditions exhibit a syndromic presentation, featuring overlapping signs and symptoms related to urinary dysfunction, which complicates the process of achieving an early and accurate diagnosis (3). Quantification of prostate-specific antigen (PSA) is the cornerstone diagnostic biomarker (18); Its specificity, however, is reduced because both BPH and prostate cancer are associated with elevated PSA (19). Furthermore, systemic inflammation and altered hematological indices have been identified as potential contributory factors or manifestations of prostate pathology. This supports the hypothesis that a broader biomarker landscape will improve diagnosis (16). This study aimed to identify biochemical and hematological profiles that separate PC from BPH in men aged >50 years, utilizing measures of PSA parameters, inflammatory markers, and blood cell indices. Our findings indicate significant distinctions between PC and BPH patients across several parameters. As expected, tPSA and fPSA were significantly higher in the PC cases, validating their established role as diagnostic markers. As expected from the literature, fPSA and tPSA showed relatively high discriminatory power in ROC analysis (AUC = 0.804 and 0.760, respectively), particularly fPSA for separating malignant from benign disease. Consistent with our findings, Bing-Zi Zou et al. reported tPSA and fPSA as accurate predictors of PC (AUCs = 0.820 and 0.867, respectively) (20).However, the PSA ratio did not differ appreciably between groups in our population, reflecting the heterogeneous diagnostic utility documented in another research. This contradicts another study by Azizul Islam et al., which found that the free-to-total PSA ratio was more diagnostic (91.67%) than tPSA (61.65%) in the 4–10 ng/mL PSA range (21). Hematologically, the PC subjects had lower RBC levels and hemoglobin (Hb) concentrations compared with BPH patients, very likely due to anemia of cancer and chronic disease states or bone marrow involvement. This is consistent with the finding of Coradduzza et al., who identified Hb as one of the key diagnostic parameters for PC, along with PSA, age, and others (22). Interestingly, neutrophil levels were higher in BPH, while lymphocyte levels were higher in PC cases, resulting in a significantly lower neutrophil-to-lymphocyte ratio (NLR) in the cancer group. This is in contrast to previous studies where high NLR was associated with cancer progression, suggesting that the diagnostic value of NLR may be influenced by patient population or disease stage. Mukhiya et al., for example, found no significant difference between the PC and BPH groups in NLR (p = 0.150) or PLR (p = 0.070) (12), while Shi et al. reported that PLR and SII are significantly correlated with BPH risk (13). Patients with PC had significantly increased systemic inflammation as reflected by high CRP levels; Seventy percent of PC patients had CRP 3+ levels, compared with only 3.4 % of patients with BPH. This is consistent with the growing evidence that tumor-related inflammation is a cause of carcinogenesis and may be used as an additional biomarker. However, findings in the literature are inconsistent. Ayyildiz et al. reported no significant difference in CRP between the PC and BPH groups (p = 0.779) (20), whereas YA Mensah-Bonsu et al. found that CRP was significantly increased in patients with PC (14). Conversely, increased CRP levels were reported in BPH patients compared to healthy controls, with heterogeneity reported in studies (15). In addition, recent publications have explored in more detail the diagnostic potential of inflammation and hematological markers (e.g., Guo and colleagues). They concluded that PSA, neutrophils (NEU), monocytes, CRP and NLR were significantly elevated in patients with PC and are valuable diagnostic indicators (16, 23). Mehta et al. also demonstrated that higher NLR (>3.44) and PLR (>165.96) were strong discriminators for PC (24). Yun et al. reported that PSA was positively correlated with neutrophil counts, NLR, PLR, and erythrocyte sedimentation rate (ESR), but not with CRP or lymphocyte counts (25). Our correlation study also showed that fPSA was negatively correlated with monocytes (r = –0.532, p = 0.002). However, the PLR was strongly correlated with fPSA (r = 0.718, p < 0.001) and the uric acid was weakly correlated with tPSA (r = 0.294, p = 0.033) and moderately correlated with ESR. The role of inflammatory markers in disease progression was further confirmed in a retrospective study, which showed that NLR, PLR, and red cell distribution width (RDW) were significantly higher in patients with PC and correlated with aggressive disease markers (26). Elevated CRP in PC may be a contributor to tumor growth, as meta-analytic data show (27), while the occasional finding of lower NLR in some cancer patients indicates heterogeneity in the population (28). These findings reveal the complexity of the systemic immune mechanisms and of prostate diseases (29). Although this research provides robust conclusions, a few caveats should be borne in mind. The relatively small size of the sample, especially for the PC group, may compromise the generalizability of the results. Using a larger cohort would increase statistical power and reduce selection bias. Moreover, the cross-sectional design of the study does not allow causal inference, as longitudinal research on changes in biomarkers over time can better define their role in diagnosis and prognosis. Another limitation is the lack of histopathological stratification as the study did not classify patients with PC according to Gleason score or disease stage, which may have an impact on the hematological and inflammatory profile. Future studies should include tumor aggressiveness as a major variable in the analyses.
Moreover, as a single-center study, the study may have geographical or demographic biases, which could be avoided by working together in more than one center. The PSA, CRP, and NLR panels in this study were limited and did not include other recently developed markers such as interleukin-6, prostate health index (PHI), and exosome-derived markers which may provide additional diagnostic utility.
In order to overcome these limitations, future studies must prioritize prospective, multicenter studies with long-term follow-up to ensure the diagnostic and prognostic usefulness of the biomarkers identified.
The extension of the scope to include advanced biomarkers such as cDNA, microRNAs, and inflammatory cytokines may further increase the accuracy of the diagnosis. The use of machine learning algorithms to develop predictive models based on clinical, hematologic, and inflammatory markers may also improve PC detection and risk stratification. In addition, stratification of patients by stage and by Gleason score may reveal diagnostic or prognostic signs specific to a particular stage.
The inclusion of healthy age-matched controls would help to distinguish between age- and disease-specific changes. Finally, experimental studies could evaluate whether these observed inflammatory changes, such as increased CRP, are a cause of PC progression or a secondary effect.
5. Conclusion
This study revealed significant biochemical and hematological differences between patients with PC and BPH, and highlighted the diagnostic utility of PSA parameters in the presence of inflammatory markers. Both total and free PSA levels were significantly higher in PC, which reaffirms the role of PSA as a first-line diagnostic biomarker. In addition, inflammatory indices such as CRP showed a strong correlation with malignancy, suggesting that systemic inflammation plays a central role in the pathophysiology of PC and may improve diagnostic specificity when combined with PSA testing.
6. Declarations
6.1 Acknowledgments
The authors express their sincere gratitude to the patients who participated in this study.
We also extend our thanks to the staff and personnel of the respective clinical and laboratory departments at Mazandaran University of Medical Sciences for their invaluable assistance in data and sample collection.
6.2 Ethical Considerations
The study protocol was reviewed and approved by the Ethics Committee of Mazandaran University of Medical Sciences (Approval Code: IR.MAZUMS.REC.1404.123), and written informed consent was obtained from all participants in accordance with the principles of the Declaration of Helsinki.
6.3 Authors' Contributions
H.A.S.A.: Conceptualization, Data curation, Formal analysis, Writing – original draft.
H.M.: Investigation, Methodology, Data curation.
H.M. (Hossein Mokhtari): Software, Validation, Formal analysis.
N.M.Q.: Investigation, Resources.
F.L.A.: Writing – review & editing.
A.K.: Supervision, Project administration, Writing – review & editing.
A.D.: Supervision, Conceptualization, Resources.
All authors reviewed and approved the final version of the manuscript.
6.4 Conflict of Interest
The authors declare that they have no conflict of interest.
6.5 Fund or Financial Support
None
6.6 Using Artificial Intelligence Tools (AI Tools)
The authors were not utilized AI Tools.
Type of Study: Original Research Article |
Subject:
Clinical Medicine
Received: 2025/11/22 | Accepted: 2026/04/12 | Published: 2026/05/20
Received: 2025/11/22 | Accepted: 2026/04/12 | Published: 2026/05/20
References
1. Tang X, Liu Z, Ren J, Cao Y, Xia S, Sun Z, et al. Comparative RNA-sequencing analysis of the prostate in a mouse model of benign prostatic hyperplasia with bladder outlet obstruction. Molec Cell Biochem. 2023;478(12):2721-37. [DOI:10.1007/s11010-023-04695-2] [PMID] [PMCID]
2. Chen X, Yang S, He Z, Chen Z, Tang X, Lin Y, et al. Comprehensive analysis of the global, regional, and national burden of benign prostatic hyperplasia from 1990 to 2021. Sci Rep. 2025;15(1):5644. [DOI:10.1038/s41598-025-90229-3] [PMID] [PMCID]
3. Rawla P. Epidemiology of prostate cancer. W J Oncol. 2019;10(2):63. [DOI:10.14740/wjon1191] [PMID] [PMCID]
4. Lerner LB, McVary KT, Barry MJ, Bixler BR, Dahm P, Das AK, et al. Management of lower urinary tract symptoms attributed to benign prostatic hyperplasia: AUA guideline part I-initial work-up and medical management. J Urol. 2021;206(4):806-17. [DOI:10.1097/JU.0000000000002184] [PMID]
5. Merriel SW, Pocock L, Gilbert E, Creavin S, Walter FM, Spencer A, et al. Systematic review and meta-analysis of the diagnostic accuracy of prostate-specific antigen (PSA) for the detection of prostate cancer in symptomatic patients. BMC Med. 2022;20(1):54. [DOI:10.1186/s12916-021-02230-y] [PMID] [PMCID]
6. Bhindi A, Bhindi B, Kulkarni GS, Hamilton RJ, Toi A, van der Kwast TH, et al. Modern-day prostate cancer is not meaningfully associated with lower urinary tract symptoms: Analysis of a propensity score-matched cohort. Canadian Urol Assoc J. 2017;11(1-2):41. [DOI:10.5489/cuaj.4031] [PMID] [PMCID]
7. Cicione A, Cormio L, Cantiello F, Palumbo IM, De Nunzio C, Lima EARd, et al. Presence and severity of lower urinary tract symptoms are inversely correlated with the risk of prostate cancer on prostate biopsy. Minerva Urol Nephrol. 2017;69(5):486-92 [DOI:10.23736/S0393-2249.17.02737-0] [PMID]
8. Chen Y, Yan H, Xu Y, Chen K, Yang R, Yang J, et al. Analysis of the predictive value of the prostate-specific antigen-to-neutrophil ratio for the diagnosis of prostate cancer. Disc Oncol. 2025;16(1):13. [DOI:10.1007/s12672-025-01760-8] [PMID] [PMCID]
9. Oruqi M, Krasniqi B, Gashi H, Neziri A, Podvorica E. Relationship between age, prostate size, and Prostate-Specific Antigen (PSA) role in patients with Benign Prostatic Hyperplasia (BPH). Onkol Radioter. 2024;18(4).
10. Leboutte F, Schykowski T, Van de Plas J, Lemmer O, Neisius A. Retrospective, single center evaluation of transperineal prostate biopsy omitting antibiotic prophylaxis and omitting periinterventional screening for bacteriuria. W J Urol. 2025;43(1):378. [DOI:10.1007/s00345-025-05672-8] [PMID] [PMCID]
11. Gravestock BP, Matthew MSh, BM B, Veeratterapillay MR, Heer BR. Prostate cancer diagnosis: In: Urologic Cancers [Internet]. Brisbane (AU): Exon Publications; 2022. Chapter 12. [DOI:10.36255/exon-publications-urologic-cancers-prostate-cancer-biopsy] [PMID]
12. Mukhiya GK, Mukhiya GW, Jain N, Jain M, Mukhiya K. Predicting significance of blood parameters in diagnosis of prostate carcinoma in a tertiary center in Udaipur, Rajasthan. J Clin Diag Res. 2021;15(4). [DOI:10.7860/JCDR/2021/48409.14773]
13. Shi C, Cao H, Zeng G, Yang L, Wang Y. The relationship between complete blood cell count-derived inflammatory biomarkers and benign prostatic hyperplasia in middle-aged and elderly individuals in the United States: Evidence from NHANES 2001-2008. Plos one. 2024;19(7):e0306860. [DOI:10.1371/journal.pone.0306860] [PMID] [PMCID]
14. Mensah-Bonsu YA, Appiah KAA, Dedjoe V, Djankpa FT, Ainooson GK, Ntim EA. Ratios of prostate-specific antigen to albumin, C-reactive protein, and haemoglobin concentration are valuable markers to predict patients with either prostate cancer or benign prostate hyperplasia. 2024. PREPRINT (Version 1) available at Research Square [
https://doi.org/10.21203/rs.3.rs-4326102/v1 [DOI:10.21203/rs.3.rs-4326102/v1]]
15. Yu S, Zhang C, Zhang W, Qian C, Tong X, Yuan H. Study on the clinical application value of serum inflammatory markers in benign prostatic hyperplasia. Clin Lab. 2025;71(1). [DOI:10.7754/Clin.Lab.2024.240607]
16. Guo P, Garu A, Chen T, Guo Y, Tang Y, Pan J, et al. A hematological and inflammatory marker-based model for prostate carcinoma diagnosis. Am J Cancer Res. 2025;15(6):2551. [DOI:10.62347/TVFQ4646] [PMID] [PMCID]
17. Wang H, Tang R, Luo S, Hou H, Liu J, Liu M, et al. Association of life's crucial 9 score with benign prostatic hyperplasia: a cross-sectional study. J Health Popul Nutr. 2025;44(1):163. [DOI:10.1186/s41043-025-00925-z] [PMID] [PMCID]
18. Navarro RE, González-Padilla DA, Subiela JD, Pérez-Serrano C, Olmos D, Carlsson SV. Prostate cancer screening. Asian J Urol. 2024.
19. Sajadi A, Nooraei M, Ghorbani A, Alimohammadian M, Zahedi M-J, Darvish MS, et al. The incidence of prostate cancer in Iran: results of a population-based cancer registry.Arch Iran Med. 2007;10(4):481-5
20. Ayyıldız SN, Benli E, Çırakoğlu A, Ayyıldız A. Comparison of serum c-reactive protein levels between benign prostate hyperplasia and prostate cancer in patients undergoing prostate biopsy.New J Urol.2016;11(3):10-15
21. Islam MA, Islam SS, Haque MJ, Hossain MM. Ability of free/total serum PSA ratio in diagnosing prostate cancer and benign prostatic hyperplasia. J Teach Assoc. 2023;36(2):101-9. [DOI:10.3329/taj.v36i2.71537]
22. Coradduzza D, Sibono L, Tedde A, Marra S, De Miglio MR, Zinellu A, et al. Diagnostic stratification of prostate cancer through blood-based biochemical and inflammatory markers. Diagnostics. 2025;15(11):1385. [DOI:10.3390/diagnostics15111385] [PMID] [PMCID]
23. Guo P , A G , Chen T , Guo Y , Tang Y , Pan J ,et al. A hematological and inflammatory marker-based model for prostate carcinoma diagnosis.Am J Cancer Res.2025;15(6):2251-63 [DOI:10.62347/TVFQ4646] [PMID] [PMCID]
24. Mehta S, Ketkar M, Jain D. Role of neutrophil-to-lymphocyte ratio (NLR) and platelet-to-lymphocyte ratio (PLR) in predicting carcinoma prostate (CaP) in patients with lower urinary tract symptoms and raised serum prostate-specific antigen (sr. PSA). Med J Arm Forc India. 2024;80:S160-S6. [DOI:10.1016/j.mjafi.2023.03.001] [PMID] [PMCID]
25. Yun J, Lee H, Yang W. Association between systemic inflammation and serum prostate-specific antigen in a healthy Korean population. Turk J Urol. 2017;43(3):284. [DOI:10.5152/tud.2017.25901] [PMID] [PMCID]
26. Sun Z, Ju Y, Han F, Sun X, Wang F. Clinical implications of pretreatment inflammatory biomarkers as independent prognostic indicators in prostate cancer. J Clin Lab Analysis. 2018;32(3):e22277. [DOI:10.1002/jcla.22277] [PMID] [PMCID]
27. Liu T, Zhuo L. [Retracted] The role of C‐reactive protein in the prognosis of prostate cancer: A meta‐analysis. J Environ Public Health. 2023;2023(1):6222324. [DOI:10.1155/2023/6222324] [PMID] [PMCID]
28. Tang L, Li X, Wang B, Luo G, Gu L, Chen L, et al. Prognostic value of neutrophil-to-lymphocyte ratio in localized and advanced prostate cancer: a systematic review and meta-analysis. PloS one. 2016;11(4):e0153981. [DOI:10.1371/journal.pone.0153981] [PMID] [PMCID]
29. Tang Z, Li S, Zeng M, Zeng L, Tang Z. The association between systemic immune-inflammation index and prostate-specific antigen: results from NHANES 2003-2010. PLoS One. 2024;19(11):e0313080. [DOI:10.1371/journal.pone.0313080] [PMID] [PMCID]
| Rights and permissions | |
 |
This work is licensed under a Creative Commons Attribution-NonCommercial 4.0 International License. |
Copyright Policy
Journal of Advances in Medical and Biomedical Research by Zanjan University of Medical Sciences is licensed under CC BY-NC 4.0