
Fri, Oct 2, 2026
[Archive]
Volume 34, Issue 3 (May & June 2026)
J Adv Med Biomed Res 2026, 34(3): 281-292 |
Back to browse issues page



Download citation:
BibTeX | RIS | EndNote | Medlars | ProCite | Reference Manager | RefWorks
Send citation to:


BibTeX | RIS | EndNote | Medlars | ProCite | Reference Manager | RefWorks
Send citation to:
Ali Hussein H, N. Salman M, Alwan Algenabi A. Associations of Sex Hormone-Binding Globulin Gene Polymorphisms and Circulating Levels with Metabolic Dysfunction in an Iraqi Population: A Case-Control Study. J Adv Med Biomed Res 2026; 34 (3) :281-292
URL: http://journal.zums.ac.ir/article-1-8022-en.html
URL: http://journal.zums.ac.ir/article-1-8022-en.html


1- Department of Clinical Laboratory Sciences, College of Pharmacy, Jabir Ibn Hayyan University for Medical and Pharmaceutical Sciences, Iraq
2- Department of Clinical Laboratory Sciences, College of Pharmacy, Jabir Ibn Hayyan University for Medical and Pharmaceutical Sciences, Iraq ,mohammed.noori@jmu.edu.iq
3- Department of Biochemistry, College of Medicine, Kufa University, Iraq
2- Department of Clinical Laboratory Sciences, College of Pharmacy, Jabir Ibn Hayyan University for Medical and Pharmaceutical Sciences, Iraq ,
3- Department of Biochemistry, College of Medicine, Kufa University, Iraq
Keywords: Sex hormone-binding globulin, rs1799941, rs6257, insulin resistance, type 2 diabetes mellitus.
Full-Text [PDF 511 kb]
(88 Downloads)
| Abstract (HTML) (550 Views)
Table 1. The study population baseline demographic, anthropometric, and biochemical characteristics
.png)
Table 2. The study groups’ genotype and allele frequencies of SHBG gene polymorphisms (rs1799941, rs6257).
Table 3. Multinomial Logistic Regression Analysis of the Association between SHBG Gene Polymorphisms and Insulin Resistance or Type 2 Diabetes Mellitus (Control Group as the Reference Category).
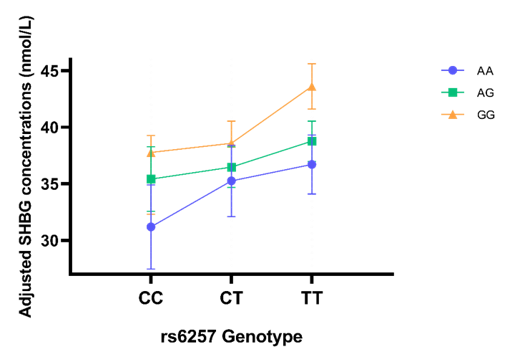
Table 5. Adjusted mean serum SHBG concentrations (nmol/L), estimated marginal means (95% CI).
Full-Text: (38 Views)
ABSTRACT
Background & Objective: One of the newly reported novel biomarkers is sex hormone-binding globulin (SHBG) which is nowadays considered as a potential predictor for type 2 diabetes mellitus (T2DM) and metabolic dysfunction. Polymorphism of SHBG gene may lead to changes in serum SHBG levels which could lead to different metabolic conditions. This study aimed to investigate these associations in Iraqi population.
Materials & Methods: This was a case-control study by using 600 specimens. A quantitative enzyme-linked immunosorbent assay (ELISA) with other standardized laboratory techniques were used. By using TaqMan real-time polymerase chain reaction assays all genotyping for the polymorphisms [rs1799941 and rs6257] was performed. Chi-square test, multinomial logistic regression, two-way ANCOVA and ROC analysis was performed to assess statistical analysis.
Results: Serum SHBG concentrations steadily decreased along the metabolic continuum from healthy controls to individuals with IR and patients with T2DM (P < 0.001). After assessing genotype distributions, it was found that a significant differences (P < 0.001). rs1799941 AA and rs6257 CC genotypes were independently linked to T2DM susceptibility. Both polymorphisms independently significantly affected circulating SHBG concentrations (P = 4.7 × 10⁻¹² and P = 0.03). SHBG demonstrated great discriminatory performance with area under the curve (AUC) of 0.928 (95% CI: 0.903–0.953) and this was used to differentiate T2DM from healthy controls.
Conclusion: A significant association was observed between decreased circulating SHBG concentrations and metabolic changes or T2DM. Both concentrations of SHBG in serum and risk of T2DM are independently correlated with the SHBG polymorphisms rs1799941 and rs6257.
Keywords: Sex hormone-binding globulin; rs1799941; rs6257; Insulin resistance; Type 2 diabetes mellitus.
Background & Objective: One of the newly reported novel biomarkers is sex hormone-binding globulin (SHBG) which is nowadays considered as a potential predictor for type 2 diabetes mellitus (T2DM) and metabolic dysfunction. Polymorphism of SHBG gene may lead to changes in serum SHBG levels which could lead to different metabolic conditions. This study aimed to investigate these associations in Iraqi population.
Materials & Methods: This was a case-control study by using 600 specimens. A quantitative enzyme-linked immunosorbent assay (ELISA) with other standardized laboratory techniques were used. By using TaqMan real-time polymerase chain reaction assays all genotyping for the polymorphisms [rs1799941 and rs6257] was performed. Chi-square test, multinomial logistic regression, two-way ANCOVA and ROC analysis was performed to assess statistical analysis.
Results: Serum SHBG concentrations steadily decreased along the metabolic continuum from healthy controls to individuals with IR and patients with T2DM (P < 0.001). After assessing genotype distributions, it was found that a significant differences (P < 0.001). rs1799941 AA and rs6257 CC genotypes were independently linked to T2DM susceptibility. Both polymorphisms independently significantly affected circulating SHBG concentrations (P = 4.7 × 10⁻¹² and P = 0.03). SHBG demonstrated great discriminatory performance with area under the curve (AUC) of 0.928 (95% CI: 0.903–0.953) and this was used to differentiate T2DM from healthy controls.
Conclusion: A significant association was observed between decreased circulating SHBG concentrations and metabolic changes or T2DM. Both concentrations of SHBG in serum and risk of T2DM are independently correlated with the SHBG polymorphisms rs1799941 and rs6257.
Keywords: Sex hormone-binding globulin; rs1799941; rs6257; Insulin resistance; Type 2 diabetes mellitus.
1. Introduction
Diabetes mellitus is one of the most prevalent chronic metabolic disorders worldwide. According to estimates from the International Diabetes Federation (IDF) and Sun Life, more than 600 million people were at high risk of developing diabetes in 2026 (1). More than 90% of affected individuals have T2DM, a condition typically preceded by IR and relative insulin deficiency. The continuously increasing prevalence of T2DM, together with its substantial burden of morbidity, premature mortality, and healthcare costs, has made it a major global public health challenge (2).
The pathogenesis of T2DM is characterized by a gradual continuum of metabolic abnormalities, with insulin resistance representing the earliest detectable defect before the onset of overt hyperglycemia. Persistent impairment of insulin sensitivity increases the functional demand on pancreatic β-cells, leading to progressive β-cell dysfunction and, ultimately, the clinical manifestation of T2DM. Although excess adiposity, sedentary lifestyle, and genetic predisposition are well-established risk factors for disease development (3), accumulating evidence indicates that additional molecular and biochemical mechanisms play pivotal roles in the development and progression of insulin resistance and T2DM. Interest in sex hormone-binding globulin has increased substantially over the past decade because of its biological functions and emerging role in metabolic diseases. SHBG is a glycosylated homodimeric plasma glycoprotein synthesized predominantly by hepatocytes. It binds sex steroids, including testosterone and dihydrotestosterone (DHT), with a higher affinity than estradiol, thereby regulating their bioavailability and biological activity (4). Although SHBG was traditionally regarded primarily as a transport protein for circulating sex hormones, it is now increasingly recognized as an important biomarker associated with glucose homeostasis, insulin resistance, and T2DM (5). Numerous epidemiological and clinical studies have demonstrated that reduced circulating SHBG concentrations are associated with obesity, metabolic syndrome, insulin resistance, and an increased risk of developing T2DM across diverse populations (6–8). Consequently, circulating SHBG has emerged as a promising biomarker of metabolic dysfunction, with evidence suggesting that it may improve the prediction of T2DM beyond conventional clinical and biochemical risk factors (9). Furthermore, polymorphisms in the SHBG gene have been reported to influence circulating SHBG concentrations and may contribute not only to metabolic disorders but also to interindividual differences in susceptibility to these conditions. The SHBG gene is located on chromosome 17p13. Among its genetic variants, rs1799941, located in the promoter region, and rs6257, located within an intronic region, have been extensively investigated because of their reported associations with SHBG gene expression and circulating protein concentrations (10). These polymorphisms have been linked to alterations in circulating SHBG levels, insulin resistance, T2DM, and related metabolic phenotypes (11). However, the findings have been inconsistent across different populations (8). Such discrepancies may reflect differences in genetic background, ancestral origin, environmental exposures, participant characteristics, and methodological approaches among studies. Although several investigations have examined SHBG polymorphisms and circulating SHBG concentrations in European and East Asian populations, evidence from Arab and Middle Eastern populations remains limited. In particular, data regarding the associations of the rs1799941 and rs6257 variants with insulin resistance, circulating SHBG concentrations, and T2DM in Iraqi individuals are scarce (12). Given the genetic diversity and the unique environmental and lifestyle characteristics of Middle Eastern populations, the applicability of findings from other ethnic groups to this population remains uncertain (13).
Therefore, the influence of SHBG genetic variation on circulating SHBG concentrations and metabolic dysfunction across different ethnic populations has not yet been fully elucidated. These inconsistencies should be considered carefully, as genetic background and environmental factors may modify the biological effects of individual alleles and their frequencies within different populations (14).
We hypothesized that the SHBG gene polymorphisms rs1799941 and rs6257 influence circulating SHBG concentrations and are independently associated with insulin resistance and T2DM among Iraqi adults.
Accordingly, this study aimed to investigate the relationships among circulating SHBG concentrations, SHBG gene polymorphisms (rs1799941 and rs6257), insulin resistance, and T2DM in an Iraqi population. We further examined whether these genetic variants were independently associated with susceptibility to metabolic dysfunction and circulating SHBG concentrations after adjustment for relevant clinical and metabolic covariates. In addition, we evaluated the interaction between the two polymorphisms to determine whether their combined effects differed from those expected under an additive genetic model.
We further hypothesized that reduced circulating SHBG concentrations, in combination with risk-associated SHBG genotypes, would be associated with progression from insulin resistance to overt T2DM.
2. Materials and Methods
2.1 Study Setting and Population
This hospital-based case-control study was conducted between December 2025 and April 2026 at the Center for Diabetes and Endocrinology, Medical City of Al-Sadr, Najaf Health Directorate, Najaf, Iraq. Eligible participants with IR or T2DM were consecutively recruited from the Diabetes and Endocrinology Center during the study period. Healthy controls were recruited concurrently from individuals attending the same institution for routine health examinations and were confirmed to have no history of diabetes or insulin resistance based on clinical evaluation and laboratory investigations. A total of 600 adult participants were enrolled and equally allocated into three study groups: 200 healthy controls, 200 individuals with insulin resistance, and 200 patients with T2DM, as illustrated in Figure 1. To minimize the influence of potential confounding factors, demographic variables, including age and sex, were adjusted for in the multivariable statistical analyses.
.png)
The pathogenesis of T2DM is characterized by a gradual continuum of metabolic abnormalities, with insulin resistance representing the earliest detectable defect before the onset of overt hyperglycemia. Persistent impairment of insulin sensitivity increases the functional demand on pancreatic β-cells, leading to progressive β-cell dysfunction and, ultimately, the clinical manifestation of T2DM. Although excess adiposity, sedentary lifestyle, and genetic predisposition are well-established risk factors for disease development (3), accumulating evidence indicates that additional molecular and biochemical mechanisms play pivotal roles in the development and progression of insulin resistance and T2DM. Interest in sex hormone-binding globulin has increased substantially over the past decade because of its biological functions and emerging role in metabolic diseases. SHBG is a glycosylated homodimeric plasma glycoprotein synthesized predominantly by hepatocytes. It binds sex steroids, including testosterone and dihydrotestosterone (DHT), with a higher affinity than estradiol, thereby regulating their bioavailability and biological activity (4). Although SHBG was traditionally regarded primarily as a transport protein for circulating sex hormones, it is now increasingly recognized as an important biomarker associated with glucose homeostasis, insulin resistance, and T2DM (5). Numerous epidemiological and clinical studies have demonstrated that reduced circulating SHBG concentrations are associated with obesity, metabolic syndrome, insulin resistance, and an increased risk of developing T2DM across diverse populations (6–8). Consequently, circulating SHBG has emerged as a promising biomarker of metabolic dysfunction, with evidence suggesting that it may improve the prediction of T2DM beyond conventional clinical and biochemical risk factors (9). Furthermore, polymorphisms in the SHBG gene have been reported to influence circulating SHBG concentrations and may contribute not only to metabolic disorders but also to interindividual differences in susceptibility to these conditions. The SHBG gene is located on chromosome 17p13. Among its genetic variants, rs1799941, located in the promoter region, and rs6257, located within an intronic region, have been extensively investigated because of their reported associations with SHBG gene expression and circulating protein concentrations (10). These polymorphisms have been linked to alterations in circulating SHBG levels, insulin resistance, T2DM, and related metabolic phenotypes (11). However, the findings have been inconsistent across different populations (8). Such discrepancies may reflect differences in genetic background, ancestral origin, environmental exposures, participant characteristics, and methodological approaches among studies. Although several investigations have examined SHBG polymorphisms and circulating SHBG concentrations in European and East Asian populations, evidence from Arab and Middle Eastern populations remains limited. In particular, data regarding the associations of the rs1799941 and rs6257 variants with insulin resistance, circulating SHBG concentrations, and T2DM in Iraqi individuals are scarce (12). Given the genetic diversity and the unique environmental and lifestyle characteristics of Middle Eastern populations, the applicability of findings from other ethnic groups to this population remains uncertain (13).
Therefore, the influence of SHBG genetic variation on circulating SHBG concentrations and metabolic dysfunction across different ethnic populations has not yet been fully elucidated. These inconsistencies should be considered carefully, as genetic background and environmental factors may modify the biological effects of individual alleles and their frequencies within different populations (14).
We hypothesized that the SHBG gene polymorphisms rs1799941 and rs6257 influence circulating SHBG concentrations and are independently associated with insulin resistance and T2DM among Iraqi adults.
Accordingly, this study aimed to investigate the relationships among circulating SHBG concentrations, SHBG gene polymorphisms (rs1799941 and rs6257), insulin resistance, and T2DM in an Iraqi population. We further examined whether these genetic variants were independently associated with susceptibility to metabolic dysfunction and circulating SHBG concentrations after adjustment for relevant clinical and metabolic covariates. In addition, we evaluated the interaction between the two polymorphisms to determine whether their combined effects differed from those expected under an additive genetic model.
We further hypothesized that reduced circulating SHBG concentrations, in combination with risk-associated SHBG genotypes, would be associated with progression from insulin resistance to overt T2DM.
2. Materials and Methods
2.1 Study Setting and Population
This hospital-based case-control study was conducted between December 2025 and April 2026 at the Center for Diabetes and Endocrinology, Medical City of Al-Sadr, Najaf Health Directorate, Najaf, Iraq. Eligible participants with IR or T2DM were consecutively recruited from the Diabetes and Endocrinology Center during the study period. Healthy controls were recruited concurrently from individuals attending the same institution for routine health examinations and were confirmed to have no history of diabetes or insulin resistance based on clinical evaluation and laboratory investigations. A total of 600 adult participants were enrolled and equally allocated into three study groups: 200 healthy controls, 200 individuals with insulin resistance, and 200 patients with T2DM, as illustrated in Figure 1. To minimize the influence of potential confounding factors, demographic variables, including age and sex, were adjusted for in the multivariable statistical analyses.
Figure 1. A Diagram for Study Flow. (Prepared by Authors, 2026).
All the participants were enrolled during standard outpatient visits. Demographic data, medical history, anthropometric measurements, and all results obtained in laboratory collected by using a structured case report form. Body mass index (BMI) = weight, in kilograms/ (height in meters) ^2 (kg/m²).
According to the American Diabetes Association (ADA) Standards of Care in Diabetes-2025, the diagnosis of T2DM case was established (14). Insulin resistance was defined as HOMA-IR ≥2.5, in accordance with the previous published criteria (15).
2.2 Eligibility Criteria
Adults aged ≥18 years who presented to the Diabetes and Endocrinology Center during the study period were enrolled in this cohort. Categorized groups of the participants were healthy controls, individuals with IR, and patients with T2DM. Selection of healthy controls according to whether they were free from past history of diabetes or any other major metabolic disorder, with normal FBG, HbA1c and HOMA-IR values (< 2.5).
The IR group consisted of subjects with a HOMA-IR value ≥2.5 who did not meet the diagnostic criteria for T2DM according to the ADA, on the other hand, the T2DM group were participants whom coincide with 2025 clinical diagnostic criteria for type 2 diabetes mellitus and met ADA (14). Excluded case were: patients with type 1 diabetes mellitus, gestational diabetes, pregnancy, chronic liver or kidney disease and thyroid disorders, a history of active malignancy, acute or chronic inflammatory conditions, and any disorder that could affect glucose metabolism or circulating SHBG concentrations. Other excluded statuses were those whom treated with drugs that significantly affect SHBG levels (androgen replacement therapy, estrogen-containing compounds, or systemic glucocorticoids).
2.3 Clinical and Anthropometric Assessment
Baseline demographic and clinical characteristics, including age, sex, medical history, medication use treatment, and Family History Study (FHS) of diabetes was collected by means of a previously standardized case report form. Anthropometric measurements consisted of body weight and height. Measurements of fasting glucose concentration (FGC) were retrieved from the medical records of the Center of Diabetes and Endocrinology participants in the IR and patients T2DM groups. The trained healthcare personnel measured body weight and height directly by standard procedures in control group. By using a calibrated digital scale, with participants wearing light clothing and no shoes, the body weight was measured to the nearest 0.1 kg. Additionally, by using a wall-mounted stadiometer the height of participants was measured to the nearest 0.1 cm. Subsequently, body mass index was determined as weight in kilograms divided by the square of height in meters (kg/m²) (16).
2.4 Blood Sample Collection
Aseptic blood specimen was taken from peripheral vein, after fasting period of about 10h in standardized conditions. After that two aliquots were isolated from the collected specimens. The first aliquot transferred to serum separator tubes for biochemical analysis. After that, these specimens were centrifuged at 2,000 rpm for 10 minutes. Centrifuged samples were either analyzed immediately or preserved at -20°C until subsequent analysis (17). The second aliquot was transferred to EDTA tubes to extract genomic DNA, which will subsequently be used to genotype SHBG polymorphisms. All procedures and storage criteria were carried out according to the instructions followed by universally accepted laboratory protocols, regarding both the integrity of specimen and reliability of laboratory analysis. (18-19).
2.5 Biochemical Measurements
Serum biochemical parameters were measured using commercially available enzymatic assay kits (Spinreact, Girona, Spain) on a COBAS Integra® 400 Plus automated clinical chemistry analyzer (Roche Diagnostics, Mannheim, Germany), in accordance with the manufacturers' instructions (20-21). The analyzed biochemical parameters included fasting blood glucose (FBG), total cholesterol (TC), triglycerides (TG), high-density lipoprotein cholesterol (HDL-C), and low-density lipoprotein cholesterol (LDL-C). Serum glycated hemoglobin (HbA1c) and fasting insulin concentrations were determined using Roche Diagnostics immunoassay kits according to the manufacturer's recommended protocols.
By using the Homeostasis Model Assessment of Insulin Resistance (HOMA-IR), Insulin resistance was determined and calculated according to the following equation:
HOMA-IR = [Fasting insulin (µIU/mL) × Fasting blood glucose (mg/dL)] / 405
Serum SHBG concentrations were determined using a human SHBG ELISA kit (Sigma-Aldrich, USA; Cat. No. RAB0734), while the serum ApoB levels were measured with a human ApoB ELISA kit (Invitrogen™, Thermo Fisher Scientific, USA; Cat. No. EEL156). Assays were performed in accordance with the manufacturers' instructions, and all measurements carried out under standardized laboratory conditions.
2.6 DNA Extraction and Genotyping
Using the Add Prep Genomic DNA Extraction Kit (Add Bio, Korea) genomic DNA was extracted from peripheral whole blood samples collected in EDTA tubes in accordance with the manufacturer's instructions. The purity and concentration of DNA were assessed spectrophotometrically using a Bio Drop spectrophotometer (Bio Drop Ltd., Cambridge, UK) for quality evaluation of DNA samples. Affirming the integrity of the extracted DNA was performed by electrophoresis using 1% agarose gel. The two studied polymorphisms [rs1799941 (G>A) and rs6257 (T>C)] were selected depending on their associations with circulating SHBG concentrations and metabolic changes effect, previously reported in other populations. The investigated variants correspond to dbSNP accession numbers rs1799941 and rs6257, which were verified using the NCBI dbSNP database. (22).
TaqMan® SNP Genotyping Assays (Applied-Biosystems, Thermon-Fisher Scientific, Foster City/ CA, USA), on the Mx3005P Real-Time PCR System (Agilent Technologies, Santa Clara, CA, USA) Genotyping was performed for genotyping and allele discrimination. Genotyping of the SHBG polymorphisms (rs1799941 and rs6257) was performed using real-time PCR. The thermal cycling protocol consisted of an initial denaturation at 95°C for 5 min, followed by 40 amplification cycles of denaturation at 95°C for 20 s, annealing at 60°C for 50 s, and extension at 72°C for 30 s. This qPCR with fluorogenic (FAM and VIC labeled) probes was allowed for allelic discrimination; after amplification, thresholds were assigned for genotype and alleles calls automatically (23). To ascertain and confirm the genotyping accuracy and reproducibility, about 10% of DNA specimens were randomly chosen for the blinded repeat analysis, with a rate of concordance of greater than 99%. All PCR runs included no-template controls; the overall genotype call rate was 98%.
2.7 Statistical Analysis
By utilizing the IBM SPSS Statistics [v 25.0 (IBM Corp., Armonk, NY, USA)] all the data were analyzed. For the continuous variable’s normality, Shapiro–Wilk test was used for assessing where normal distribution were presented as the mean ± standard deviation (SD), whereas median and interquartile range (IQR) was used to report a non-normally distributed variable. For categorical variables, frequencies and percentages are presented. A two-sided P-value < 0.05 was statistically significant.
Comparisons between the three study groups were conducted using one-way ANOVA with Tukey's post hoc test for normally distributed continuous variables. Alternatively, the Kruskal–Wallis's test with Dunn's multiple-comparison test to analyze non-normally distributed variables. For categorical variables and genotype distribution between groups, Pearson's chi-square test was performed. By using chi-square goodness-of-fit test and to evaluate for deviation of genotype frequencies, the Hardy–Weinberg equilibrium (HWE) was assessed in the control group. Associations between SHBG polymorphisms and metabolic status were analyzed with multinomial logistic regression analysis adjusted for age. Age was chosen as the main covariate in order to control for a major difference between the groups and BMI was not included in the primary model due to its close physiological link with insulin resistance and T2DM, where adjusting for it may lead to over-adjustment of genetic associations examined. Two-way analysis of covariance (ANCOVA) was performed after adjustment for age, BMI, and HOMA-IR was used to evaluate the independent and combined effects of rs1799941 and rs6257 on circulating SHBG concentrations Pairwise post-hoc comparisons following ANCOVA were performed using the Bonferroni correction to adjust for multiple testing. Additionally, the ROC curve analysis was involved to assess the discriminatory performance of circulating level of serum SHBG in order to distinguish and discriminate patients with T2DM from healthy controls. By using the Youden index, the optimal cut-off value was determined. Accordingly, area under the curve was reported with corresponding 95% confidence intervals (95% CI).
3. Result
The baseline demographic and clinical characteristics of study participants were exhibited in Table 1. Most anthropometric and biochemical variables differed significantly among the three study groups. Participants with IR and T2DM showed increasing levels of BMI, FBG, HbA1c, fasting insulin, HOMA-IR, TG and ApoB compared to healthy controls, all P < 0.001). In contrast, less-so for HDL-C and serum SHBG concentrations, they fell gradually through the spectrum moving from controls to IR to T2DM (both P < 0.001). The three groups differed significantly in age, with participants from the IR and T2DM groups being older than healthy controls (P < 0.001), while sex distribution was similar across the study population (P = 0.232).
According to the American Diabetes Association (ADA) Standards of Care in Diabetes-2025, the diagnosis of T2DM case was established (14). Insulin resistance was defined as HOMA-IR ≥2.5, in accordance with the previous published criteria (15).
2.2 Eligibility Criteria
Adults aged ≥18 years who presented to the Diabetes and Endocrinology Center during the study period were enrolled in this cohort. Categorized groups of the participants were healthy controls, individuals with IR, and patients with T2DM. Selection of healthy controls according to whether they were free from past history of diabetes or any other major metabolic disorder, with normal FBG, HbA1c and HOMA-IR values (< 2.5).
The IR group consisted of subjects with a HOMA-IR value ≥2.5 who did not meet the diagnostic criteria for T2DM according to the ADA, on the other hand, the T2DM group were participants whom coincide with 2025 clinical diagnostic criteria for type 2 diabetes mellitus and met ADA (14). Excluded case were: patients with type 1 diabetes mellitus, gestational diabetes, pregnancy, chronic liver or kidney disease and thyroid disorders, a history of active malignancy, acute or chronic inflammatory conditions, and any disorder that could affect glucose metabolism or circulating SHBG concentrations. Other excluded statuses were those whom treated with drugs that significantly affect SHBG levels (androgen replacement therapy, estrogen-containing compounds, or systemic glucocorticoids).
2.3 Clinical and Anthropometric Assessment
Baseline demographic and clinical characteristics, including age, sex, medical history, medication use treatment, and Family History Study (FHS) of diabetes was collected by means of a previously standardized case report form. Anthropometric measurements consisted of body weight and height. Measurements of fasting glucose concentration (FGC) were retrieved from the medical records of the Center of Diabetes and Endocrinology participants in the IR and patients T2DM groups. The trained healthcare personnel measured body weight and height directly by standard procedures in control group. By using a calibrated digital scale, with participants wearing light clothing and no shoes, the body weight was measured to the nearest 0.1 kg. Additionally, by using a wall-mounted stadiometer the height of participants was measured to the nearest 0.1 cm. Subsequently, body mass index was determined as weight in kilograms divided by the square of height in meters (kg/m²) (16).
2.4 Blood Sample Collection
Aseptic blood specimen was taken from peripheral vein, after fasting period of about 10h in standardized conditions. After that two aliquots were isolated from the collected specimens. The first aliquot transferred to serum separator tubes for biochemical analysis. After that, these specimens were centrifuged at 2,000 rpm for 10 minutes. Centrifuged samples were either analyzed immediately or preserved at -20°C until subsequent analysis (17). The second aliquot was transferred to EDTA tubes to extract genomic DNA, which will subsequently be used to genotype SHBG polymorphisms. All procedures and storage criteria were carried out according to the instructions followed by universally accepted laboratory protocols, regarding both the integrity of specimen and reliability of laboratory analysis. (18-19).
2.5 Biochemical Measurements
Serum biochemical parameters were measured using commercially available enzymatic assay kits (Spinreact, Girona, Spain) on a COBAS Integra® 400 Plus automated clinical chemistry analyzer (Roche Diagnostics, Mannheim, Germany), in accordance with the manufacturers' instructions (20-21). The analyzed biochemical parameters included fasting blood glucose (FBG), total cholesterol (TC), triglycerides (TG), high-density lipoprotein cholesterol (HDL-C), and low-density lipoprotein cholesterol (LDL-C). Serum glycated hemoglobin (HbA1c) and fasting insulin concentrations were determined using Roche Diagnostics immunoassay kits according to the manufacturer's recommended protocols.
By using the Homeostasis Model Assessment of Insulin Resistance (HOMA-IR), Insulin resistance was determined and calculated according to the following equation:
HOMA-IR = [Fasting insulin (µIU/mL) × Fasting blood glucose (mg/dL)] / 405
Serum SHBG concentrations were determined using a human SHBG ELISA kit (Sigma-Aldrich, USA; Cat. No. RAB0734), while the serum ApoB levels were measured with a human ApoB ELISA kit (Invitrogen™, Thermo Fisher Scientific, USA; Cat. No. EEL156). Assays were performed in accordance with the manufacturers' instructions, and all measurements carried out under standardized laboratory conditions.
2.6 DNA Extraction and Genotyping
Using the Add Prep Genomic DNA Extraction Kit (Add Bio, Korea) genomic DNA was extracted from peripheral whole blood samples collected in EDTA tubes in accordance with the manufacturer's instructions. The purity and concentration of DNA were assessed spectrophotometrically using a Bio Drop spectrophotometer (Bio Drop Ltd., Cambridge, UK) for quality evaluation of DNA samples. Affirming the integrity of the extracted DNA was performed by electrophoresis using 1% agarose gel. The two studied polymorphisms [rs1799941 (G>A) and rs6257 (T>C)] were selected depending on their associations with circulating SHBG concentrations and metabolic changes effect, previously reported in other populations. The investigated variants correspond to dbSNP accession numbers rs1799941 and rs6257, which were verified using the NCBI dbSNP database. (22).
TaqMan® SNP Genotyping Assays (Applied-Biosystems, Thermon-Fisher Scientific, Foster City/ CA, USA), on the Mx3005P Real-Time PCR System (Agilent Technologies, Santa Clara, CA, USA) Genotyping was performed for genotyping and allele discrimination. Genotyping of the SHBG polymorphisms (rs1799941 and rs6257) was performed using real-time PCR. The thermal cycling protocol consisted of an initial denaturation at 95°C for 5 min, followed by 40 amplification cycles of denaturation at 95°C for 20 s, annealing at 60°C for 50 s, and extension at 72°C for 30 s. This qPCR with fluorogenic (FAM and VIC labeled) probes was allowed for allelic discrimination; after amplification, thresholds were assigned for genotype and alleles calls automatically (23). To ascertain and confirm the genotyping accuracy and reproducibility, about 10% of DNA specimens were randomly chosen for the blinded repeat analysis, with a rate of concordance of greater than 99%. All PCR runs included no-template controls; the overall genotype call rate was 98%.
2.7 Statistical Analysis
By utilizing the IBM SPSS Statistics [v 25.0 (IBM Corp., Armonk, NY, USA)] all the data were analyzed. For the continuous variable’s normality, Shapiro–Wilk test was used for assessing where normal distribution were presented as the mean ± standard deviation (SD), whereas median and interquartile range (IQR) was used to report a non-normally distributed variable. For categorical variables, frequencies and percentages are presented. A two-sided P-value < 0.05 was statistically significant.
Comparisons between the three study groups were conducted using one-way ANOVA with Tukey's post hoc test for normally distributed continuous variables. Alternatively, the Kruskal–Wallis's test with Dunn's multiple-comparison test to analyze non-normally distributed variables. For categorical variables and genotype distribution between groups, Pearson's chi-square test was performed. By using chi-square goodness-of-fit test and to evaluate for deviation of genotype frequencies, the Hardy–Weinberg equilibrium (HWE) was assessed in the control group. Associations between SHBG polymorphisms and metabolic status were analyzed with multinomial logistic regression analysis adjusted for age. Age was chosen as the main covariate in order to control for a major difference between the groups and BMI was not included in the primary model due to its close physiological link with insulin resistance and T2DM, where adjusting for it may lead to over-adjustment of genetic associations examined. Two-way analysis of covariance (ANCOVA) was performed after adjustment for age, BMI, and HOMA-IR was used to evaluate the independent and combined effects of rs1799941 and rs6257 on circulating SHBG concentrations Pairwise post-hoc comparisons following ANCOVA were performed using the Bonferroni correction to adjust for multiple testing. Additionally, the ROC curve analysis was involved to assess the discriminatory performance of circulating level of serum SHBG in order to distinguish and discriminate patients with T2DM from healthy controls. By using the Youden index, the optimal cut-off value was determined. Accordingly, area under the curve was reported with corresponding 95% confidence intervals (95% CI).
3. Result
The baseline demographic and clinical characteristics of study participants were exhibited in Table 1. Most anthropometric and biochemical variables differed significantly among the three study groups. Participants with IR and T2DM showed increasing levels of BMI, FBG, HbA1c, fasting insulin, HOMA-IR, TG and ApoB compared to healthy controls, all P < 0.001). In contrast, less-so for HDL-C and serum SHBG concentrations, they fell gradually through the spectrum moving from controls to IR to T2DM (both P < 0.001). The three groups differed significantly in age, with participants from the IR and T2DM groups being older than healthy controls (P < 0.001), while sex distribution was similar across the study population (P = 0.232).
Table 1. The study population baseline demographic, anthropometric, and biochemical characteristics
| Variable | Controls (n = 200) | IR (n = 200) | T2DM (n = 200) | P value |
| Age (years) | 38.00 (32.0–45.0) | 48.00 (40.0–55.0) | 55.0 (49.0–62.0) | <0.001 |
| Sex, n (%) | 0.232 | |||
| Male | 107 (53.5) | 90 (45.0) | 97 (48.5) | |
| Female | 93 (46.5) | 110 (55.0) | 103 (51.5) | |
| BMI (kg/m²) | 23.00 (21.40–24.52) | 30.20 (28.5–32.0) | 34.10 (31.10–35.90) | <0.001 |
| FBG (mg/dL) | 85.50 (80.25–90.80) | 107.50 (100.85–112.15) | 199.20 (166.50–235.80) | <0.001 |
| HbA1c (%) | 5.10 (4.90–5.30) | 6.00 (5.80–6.20) | 8.85 (7.80–10.20) | <0.001 |
| Fasting insulin (µIU/mL) | 6.70 (5.40–8.30) | 21.70 (17.30–24.20) | 28.20 (22.20–33.75) | <0.001 |
| HOMA-IR | 1.46 (1.14–1.81) | 5.68 (4.59–6.43) | 13.79 (10.91–17.58) | <0.001 |
| Total cholesterol (mg/dL) | 160.90 (150.93–175.07) | 209.40 (194.00–225.20) | 266.90 (236.80–287.80) | <0.001 |
| Triglycerides (mg/dL) | 106.70 (88.20–119.80) | 213.60 (185.45–241.25) | 328.90 (287.10–374.90) | <0.001 |
| HDL-C (mg/dL) | 54.80 (49.90–60.10) | 39.85 (36.05–43.80) | 33.10 (29.50–37.45) | <0.001 |
| LDL-C (mg/dL) | 86.50 (74.35–99.65) | 128.65 (113.15–141.22) | 165.70 (140.25–188.90) | <0.001 |
| Apolipoprotein B (mg/dL) | 75.15 (63.42–83.38) | 117.30 (106.65–130.45) | 161.75 (140.25–179.28) | <0.001 |
| Serum SHBG (nmol/L) | 45.97 ± 8.30 | 36.73 ± 7.41 | 29.84 ± 7.59 | <0.001 |
3.1 Serum SHBG Levels Among Control, IR, and T2DM Groups
The serum SHBG concentrations were significantly different among the groups, as also shown in Table 2. A statistically significant overall difference was observed (P < 0.001) was observed in Kruskal-Wallis’s test analysis, with Dunn's multiple-comparison test confirming significant pairwise differences between populations (all P-values < 0.001). The concentration of SHBG was decreased from the healthy controls to individuals with IR and patients with T2DM, giving an inverse relationship across the spectrum of metabolic dysfunction. The distribution of serum SHBG concentrations was shown in violin plot as illustrated in Figure 2, were both progressive downward shift in SHBG levels as well as the spread individual values within each study group.
The serum SHBG concentrations were significantly different among the groups, as also shown in Table 2. A statistically significant overall difference was observed (P < 0.001) was observed in Kruskal-Wallis’s test analysis, with Dunn's multiple-comparison test confirming significant pairwise differences between populations (all P-values < 0.001). The concentration of SHBG was decreased from the healthy controls to individuals with IR and patients with T2DM, giving an inverse relationship across the spectrum of metabolic dysfunction. The distribution of serum SHBG concentrations was shown in violin plot as illustrated in Figure 2, were both progressive downward shift in SHBG levels as well as the spread individual values within each study group.
Figure 2. Violin plot of serum SHBG concentrations in three groups. (Prepared by Authors, 2026).
3.2 Genotype and Allele Distribution
As shown in Table 2, the genotype distributions of both SHBG polymorphisms (rs1799941 and rs6257) were significantly different among all three study groups. For rs1799941, the frequency of the AA genotype gradually increased from healthy controls to IR and T2DM groups, while the GG genotype was less frequent in those three groups respectively. The same distribution pattern to rs6257 was noted, in which participants with T2DM had a higher frequency of the CC genotype than did healthy controls (all P < 0.001).
Analysis of the allele distributions confirmed that individuals with metabolic dysfunction have significantly greater frequencies of the putative risk alleles than healthy controls. The genotype distributions of the control subjects for rs1799941 and rs6257 complied with [Hardy-Weinberg equilibrium] (P = 0.266 for rs1799941; P = 0.075 for rs6257).
As shown in Table 2, the genotype distributions of both SHBG polymorphisms (rs1799941 and rs6257) were significantly different among all three study groups. For rs1799941, the frequency of the AA genotype gradually increased from healthy controls to IR and T2DM groups, while the GG genotype was less frequent in those three groups respectively. The same distribution pattern to rs6257 was noted, in which participants with T2DM had a higher frequency of the CC genotype than did healthy controls (all P < 0.001).
Analysis of the allele distributions confirmed that individuals with metabolic dysfunction have significantly greater frequencies of the putative risk alleles than healthy controls. The genotype distributions of the control subjects for rs1799941 and rs6257 complied with [Hardy-Weinberg equilibrium] (P = 0.266 for rs1799941; P = 0.075 for rs6257).
Table 2. The study groups’ genotype and allele frequencies of SHBG gene polymorphisms (rs1799941, rs6257).
| SNP | Genotype / Allele | Control (n = 200) | IR (n = 200) | T2DM (n =200) | χ² | P-value |
| rs1799941 | AA | 27 (13.5%) | 25 (12.5%) | 52 (26.0%) | ||
| AG | 83 (41.5%) | 98 (49.0%) | 96 (48.0%) | |||
| GG | 90 (45.0%) | 77 (38.5%) | 52 (26.0%) | 24.714 | <0.001 | |
| A allele | 137 (34.3%) | 148 (37.0%) | 200 (50.0%) | — | — | |
| G allele | 263 (65.8%) | 252 (63.0%) | 200 (50.0%) | — | — | |
| rs6257 | CC | 22 (11.0%) | 26 (13.0%) | 44 (22.0%) | ||
| CT | 72 (36.0%) | 92 (46.0%) | 89 (44.5%) | |||
| TT | 106 (53.0%) | 82 (41.0%) | 67 (33.5%) | 20.821 | <0.001 | |
| C allele | 116 (29.0%) | 144 (36.0%) | 177 (44.3%) | — | — | |
| T allele | 284 (71.0%) | 256 (64.0%) | 223 (55.8%) | — | — |
Note: P-value < 0.05 was considered statistically significant.
3.3 Logistic Regression Analysis
After adjusting for age, multinomial logistic regression analysis showed that both polymorphisms in the SHBG were independently associated with T2DM susceptibility (Table 3). Carriers with metabolic factors associated with the reference genotypes had 4.8-fold odds (OR) of T2DM carrying the rs1799941 AA genotype and 3.8-fold higher OR of T2DM carrying the rs6257 CC genotype.
In the insulin-resistant group, the relationship was weaker. Results after adjustment for age, the heterozygous CT genotype of rs6257 was significantly associated with IR (P =.026), whereas no statistical association was detected between the AA genotype of rs1799941 and IR. This indicates that the genetic impact of both polymorphisms shines through at a later post-insulin resistance stage, when diabetes is overt.
After adjusting for age, multinomial logistic regression analysis showed that both polymorphisms in the SHBG were independently associated with T2DM susceptibility (Table 3). Carriers with metabolic factors associated with the reference genotypes had 4.8-fold odds (OR) of T2DM carrying the rs1799941 AA genotype and 3.8-fold higher OR of T2DM carrying the rs6257 CC genotype.
In the insulin-resistant group, the relationship was weaker. Results after adjustment for age, the heterozygous CT genotype of rs6257 was significantly associated with IR (P =.026), whereas no statistical association was detected between the AA genotype of rs1799941 and IR. This indicates that the genetic impact of both polymorphisms shines through at a later post-insulin resistance stage, when diabetes is overt.
Table 3. Multinomial Logistic Regression Analysis of the Association between SHBG Gene Polymorphisms and Insulin Resistance or Type 2 Diabetes Mellitus (Control Group as the Reference Category).
| Variable | Comparison | Adjusted OR (95% CI) | P-value | Adjusted OR (95% CI) | P-value |
| IR vs Control | T2DM vs Control | ||||
| Age | Per 1-year increase | 1.17 (1.13–1.21) | <0.001 | 1.3 (1.253–1.36) | <0.001 |
| rs6257 | CC vs TT | 1.7 (0.837–3.59) | 0.139 | 3.8 (1.712–8.87) | 0.001 |
| CT vs TT | 1.8 (1.141–3.10) | 0.013 | 2.7 (1.486–4.98) | 0.001 | |
| rs1799941 | AA vs GG | 1.5 (0.752–3.21) | 0.234 | 4.8(2.139–10.92) | <0.001 |
| AG vs GG | 1.2 (0.754–2.02) | 0.400 | 1.498 (0.819–2.738) | 0.189 |
Note: P-value < 0.05 was considered statistically significant.
3.4 Independent Effects of SHBG Polymorphisms on Serum SHBG Concentrations
Associations of rs1799941 and rs6257 with circulating SHBG concentrations were assessed by two-way ANCOVA adjusted for age, BMI, and HOMA-IR (Table 4; Figure 3). Both polymorphisms had independent effects on serum SHBG concentrations, but the effect of interaction was not significant (interaction P = 0.330).
It was confirmed that individuals carrying the AA genotype of rs1799941 had significantly higher circulating levels of SHBG compared with GG genotype carriers and carriers of the CC genotype of rs6257 had significantly lower plasma concentrations than TT homozygotes. It was concluded that there was lack of significant interaction between rs1799941 and rs6257 effects on circulating serum SHBG levels in an independent/additive rather than synergistic manner. According to Cohen's benchmarks, rs6257 demonstrated a moderate effect size (partial η² = 0.061), whereas rs1799941 (partial η² = 0.042) and the interaction term (partial η² = 0.012) showed small effect sizes.
3.5 Independent Effects of SHBG Polymorphisms on Serum SHBG Concentrations
Independent effects of rs6257 (P < 0.001) and rs1799941 (P < 0.001) on serum SHBG concentrations were confirmed using two-way ANCOVA adjusted for age, BMI, and HOMA-IR. The adjusted SHBG concentrations in individuals carrying the TT genotype of rs6257 were higher than CC-genotype carriers. Similarly, elevated adjusted SHBG concentrations were associated with the rs1799941 GG genotype. The interaction between rs6257 and rs1799941 was not significant (P = 0.330), demonstrating that effects of each polymorphism on SHBG concentrations were independent. Table 4 and Table 5 displays the estimated marginal means, and Figure 3 depicts the interaction plot.
Associations of rs1799941 and rs6257 with circulating SHBG concentrations were assessed by two-way ANCOVA adjusted for age, BMI, and HOMA-IR (Table 4; Figure 3). Both polymorphisms had independent effects on serum SHBG concentrations, but the effect of interaction was not significant (interaction P = 0.330).
It was confirmed that individuals carrying the AA genotype of rs1799941 had significantly higher circulating levels of SHBG compared with GG genotype carriers and carriers of the CC genotype of rs6257 had significantly lower plasma concentrations than TT homozygotes. It was concluded that there was lack of significant interaction between rs1799941 and rs6257 effects on circulating serum SHBG levels in an independent/additive rather than synergistic manner. According to Cohen's benchmarks, rs6257 demonstrated a moderate effect size (partial η² = 0.061), whereas rs1799941 (partial η² = 0.042) and the interaction term (partial η² = 0.012) showed small effect sizes.
3.5 Independent Effects of SHBG Polymorphisms on Serum SHBG Concentrations
Independent effects of rs6257 (P < 0.001) and rs1799941 (P < 0.001) on serum SHBG concentrations were confirmed using two-way ANCOVA adjusted for age, BMI, and HOMA-IR. The adjusted SHBG concentrations in individuals carrying the TT genotype of rs6257 were higher than CC-genotype carriers. Similarly, elevated adjusted SHBG concentrations were associated with the rs1799941 GG genotype. The interaction between rs6257 and rs1799941 was not significant (P = 0.330), demonstrating that effects of each polymorphism on SHBG concentrations were independent. Table 4 and Table 5 displays the estimated marginal means, and Figure 3 depicts the interaction plot.
Figure 3. Average marginal means of serum SHBG by rs6257 and rs1799941 genotypes. (Prepared by Authors, 2026).
Table 4. Two-way ANCOVA analysis of serum SHBG concentrations according to rs6257 and rs1799941 polymorphisms.
Table 4. Two-way ANCOVA analysis of serum SHBG concentrations according to rs6257 and rs1799941 polymorphisms.
| ANCOVA results | df | F | P-value | Partial η² |
| Age | 1 | 2.992 | 0.084 | 0.008 |
| BMI | 1 | 27.721 | <0.001 | 0.069 |
| HOMA-IR | 1 | 15.981 | <0.001 | 0.041 |
| rs6257 | 2 | 12.111 | <0.001 | 0.061 |
| rs1799941 | 2 | 8.254 | <0.001 | 0.042 |
| rs6257 × rs1799941 | 4 | 1.156 | 0.330 | 0.012 |
| Model R² | 0.550 | Adjusted R² = 0.537 |
Table 5. Adjusted mean serum SHBG concentrations (nmol/L), estimated marginal means (95% CI).
| rs6257 genotype | AA | AG | GG |
| CC | 31.18 (27.47–34.90) | 35.41 (32.56–38.26) | 37.78 (32.29–39.28) |
| CT | 35.26 (32.11–38.41) | 36.48 (34.67–38.28) | 38.58 (36.61–40.55) |
| TT | 36.71 (34.10–39.32) | 38.77 (36.99–40.55) | 43.62 (41.63–45.62) |
3.6 Discriminatory Performance of Serum SHBG
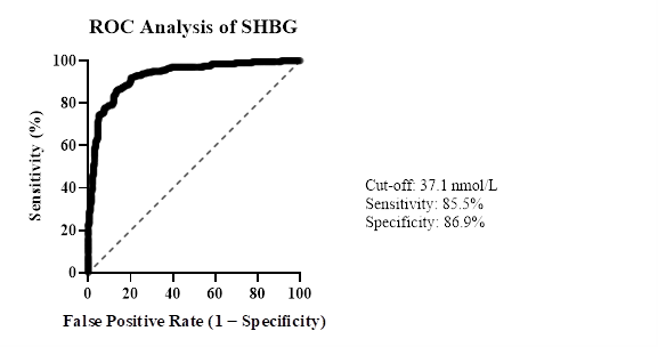
To evaluate the predictive attributions of serum SHBG concentrations for discriminating patients with T2DM from healthy controls, the ROC curve analysis was further conducted (Figure 4). Serum SHBG showed an excellent discriminatory performance (AUC 0.928; 95% CI: 0.903–0.953, P < 0.001). The studied sensitivity was 85.5% while the measured specification was 86.9% while the Youden index was 0.725, at cut-off value of 37.1 nmol/L. These results suggest that lower circulating SHBG levels could successfully differentiate T2DM from metabolically healthy controls in the study population.
To evaluate the predictive attributions of serum SHBG concentrations for discriminating patients with T2DM from healthy controls, the ROC curve analysis was further conducted (Figure 4). Serum SHBG showed an excellent discriminatory performance (AUC 0.928; 95% CI: 0.903–0.953, P < 0.001). The studied sensitivity was 85.5% while the measured specification was 86.9% while the Youden index was 0.725, at cut-off value of 37.1 nmol/L. These results suggest that lower circulating SHBG levels could successfully differentiate T2DM from metabolically healthy controls in the study population.
Figure 4. Serum SHBG concentrations between patients with type 2 DM and healthy controls. (Prepared by Authors, 2026).
4. Discussion
In this study there were three principal observations emerged. First, the serum SHBG concentrations decreased stepwise in controls, patients with insulin resistance and T2DM (Figure 2). Second, both rs1799941 and rs6257 showed independent effects on T2DM susceptibility after adjustment for age. Third, addition of each polymorphism had an additive effect on circulating SHBG concentrations, and no significant interaction was observed between the two variants. Collectively, these findings demonstrate that both biochemical and genetic variation within the SHBG pathway contribute to metabolic dysfunction and dysregulations.
Many recent studies suggested that SHBG plays a role in glucose metabolism where reduced SHBG concentrations have been associated with chronic hyperinsulinemia, hepatic steatosis, and impaired insulin signaling (24-26). Accordingly, theses prospective cohort studies have demonstrated that the development of T2DM was preceded by decreasing SHBG concentrations, consequently, providing an outstanding support that it was an early metabolic abnormality rather than a mere consequence of established diabetes (27). Additionally, to differentiate between patients from healthy control when applying ROC analysis, serum SHBG showed good discriminatory performance in this differentiation which supports the potential role of circulating SHBG when put in perspective to evaluate the risk factors to stratify the classical clinical and biochemical changes.
An estimated 4.8-fold higher odds of T2DM in association with the AA genotype of rs1799941 compared with GG homozygotes, whereas nearly fourfold were higher odds metabolic changes’ risk in accordance with the carriers of the C allele of rs6257. These findings were agreed with previous studies which reported that the susceptibility to T2DM is associated with SHBG polymorphisms and decreased level of circulating hormone concentrations (28). Notably, Perry et al., using a Mendelian randomization approach, provided genetic evidence suggesting that genetically determined higher SHBG concentrations may reduce the risk of T2DM (29). Similarly, Chen et al. and Quan et al. reported comparable associations in Asian populations (30-31). Although the magnitude of these associations differs across studies, such variability may reflect differences in ethnic background, allele frequencies, environmental exposures, study populations, and analytical approaches. Nevertheless, the overall direction of the observed associations has remained remarkably consistent across populations. Our findings extend this body of evidence by providing data from an Iraqi population, for which genetic studies on SHBG polymorphisms remain limited (32-33). In addition to providing associations with metabolic disease, this study also identified rs1799941 and rs6257 as independent predictors of circulating SHBG concentrations after adjustment for age, BMI, and HOMA-IR (all P < 10−3), yet no statistically significant interaction between the two polymorphisms was detected (33).
All this imply that both variants independently regulate SHBG and their effect is combined in an additive rather than synergistic manner. This is also consistent with the idea that circulating SHBG concentrations are the final result of a multitude of genetic and metabolic interactions because individual polymorphisms only explain partial inter-individual variability observed (34). Importantly, assessing circulating SHBG concentrations in tandem with SHBG genetic variants gives a better measure of metabolic susceptibility than either biochemical or genetic markers alone. Several strengths enhanced the present findings validity. The study high credibility was strengthened by a relatively large, well-characterized cohort encompassing healthy controls, individuals with insulin resistance, and patients with T2DM. Furthermore, SHBG polymorphisms had been integrated within the same analytical framework, in addition to all comprehensive biochemical phenotyping with genetic analysis. Another strengthen factor was the robustness of the findings through the application of multivariable regression models together with ROC curve analysis. However, certain limitations should be mentioned here, where the case-control design precluded causal inference, generalizability to other populations and this may reflect variations in allele frequencies, genetic background, environmental exposures, dietary habits, obesity prevalence, and lifestyle characteristics across different ethnic populations; due to using the single-center recruitment, and only two SHBG polymorphisms were evaluated despite the possibility that additional variants and gene-gene interactions also contribute to SHBG regulation. Moreover, unmeasured lifestyle factors, including physical activity and dietary habits represent a residual confounding from, which cannot be completely excluded (35). As a result, to validate these findings and further clarify the molecular mechanisms linking SHBG genetic variation with metabolic dysfunction a large multicenter prospective studies involving ethnically diverse populations are required (36).
5. Conclusion
A strong association between decreased plasma SHBG concentrations, genetic variation in SHBG and progression from insulin resistance to T2DM was suggested in this study. The stratification of metabolic risk by combining biochemical with genetic information could be enhanced and offering many new insights and into the biological pathways linked to diabetes susceptibility. Additionally, predicting insulin resistance and type 2 diabetes mellitus through measuring the hormone level; where lowering this hormone is proportionally correlated with these metabolic changes. On the other hand, these polymorphisms (i.e., rs1799941 and rs6257) were independently associated with circulating SHBG levels and T2DM susceptibility, and there was no noticeable interaction between the two variants. Therefore, the utility of serum SHBG measurement in conjunction with SHBG genotyping could be used to identify individuals at increased risk for metabolic dysfunction. These observations need validation from further prospective studies. A good discrimination of T2DM was achieved by measuring serum SHBG which may be a novel promising discriminator biomarker for assessing metabolic risk. Also, the associations between SHBG polymorphisms and circulating concentrations of SHBG as well as metabolic status indicate genetic information may benefit personal risk stratification. However, interventional studies are required to confirm these observations and to assess whether SHBG biochemical and genetic assays could be involved into routine clinical practice by adding incremental prediction above and beyond established clinical and biochemical parameters.
6. Declarations
6.1 Acknowledgments
Authors would like to sincerely thank the staff of both Diabetes and Endocrinology Center, Al-Sadr Medical City, Najaf Health Directorate and Department of Biochemistry, College of Medicine - University of Kufa for their help in this study providing technical support and cooperation.
6.2 Ethical Considerations
The protocol was approved after agreement from the Scientific and Ethical Committee of the College of Pharmacy, Jabir Ibn Hayyan Medical University for Medical and Pharmaceutical Sciences, Najaf, Iraq.
6.3 Authors' Contributions
Mohammed Noori Salman, Methodology, Investigation and Data Curation, Formal Analysis: Conceptualization. Writing- Original Draft & Writing- Review & Editing. Hazim Ali Hussein (Methodology, Supervision, Validation, Writing-Review & Editing) Abdulhussein Alwan Algenabi: Investigation, Resources, Data curation, Writing-Review & Editing All authors reviewed and approved the final manuscript.
6.4 Conflict of Interest
The authors declare that they have no conflicts of interest
6.5 Fund or Financial Support
No specific funding from any agency.
6.6 Using Artificial Intelligence Tools (AI Tools)
The authors were not utilized AI Tools.
In this study there were three principal observations emerged. First, the serum SHBG concentrations decreased stepwise in controls, patients with insulin resistance and T2DM (Figure 2). Second, both rs1799941 and rs6257 showed independent effects on T2DM susceptibility after adjustment for age. Third, addition of each polymorphism had an additive effect on circulating SHBG concentrations, and no significant interaction was observed between the two variants. Collectively, these findings demonstrate that both biochemical and genetic variation within the SHBG pathway contribute to metabolic dysfunction and dysregulations.
Many recent studies suggested that SHBG plays a role in glucose metabolism where reduced SHBG concentrations have been associated with chronic hyperinsulinemia, hepatic steatosis, and impaired insulin signaling (24-26). Accordingly, theses prospective cohort studies have demonstrated that the development of T2DM was preceded by decreasing SHBG concentrations, consequently, providing an outstanding support that it was an early metabolic abnormality rather than a mere consequence of established diabetes (27). Additionally, to differentiate between patients from healthy control when applying ROC analysis, serum SHBG showed good discriminatory performance in this differentiation which supports the potential role of circulating SHBG when put in perspective to evaluate the risk factors to stratify the classical clinical and biochemical changes.
An estimated 4.8-fold higher odds of T2DM in association with the AA genotype of rs1799941 compared with GG homozygotes, whereas nearly fourfold were higher odds metabolic changes’ risk in accordance with the carriers of the C allele of rs6257. These findings were agreed with previous studies which reported that the susceptibility to T2DM is associated with SHBG polymorphisms and decreased level of circulating hormone concentrations (28). Notably, Perry et al., using a Mendelian randomization approach, provided genetic evidence suggesting that genetically determined higher SHBG concentrations may reduce the risk of T2DM (29). Similarly, Chen et al. and Quan et al. reported comparable associations in Asian populations (30-31). Although the magnitude of these associations differs across studies, such variability may reflect differences in ethnic background, allele frequencies, environmental exposures, study populations, and analytical approaches. Nevertheless, the overall direction of the observed associations has remained remarkably consistent across populations. Our findings extend this body of evidence by providing data from an Iraqi population, for which genetic studies on SHBG polymorphisms remain limited (32-33). In addition to providing associations with metabolic disease, this study also identified rs1799941 and rs6257 as independent predictors of circulating SHBG concentrations after adjustment for age, BMI, and HOMA-IR (all P < 10−3), yet no statistically significant interaction between the two polymorphisms was detected (33).
All this imply that both variants independently regulate SHBG and their effect is combined in an additive rather than synergistic manner. This is also consistent with the idea that circulating SHBG concentrations are the final result of a multitude of genetic and metabolic interactions because individual polymorphisms only explain partial inter-individual variability observed (34). Importantly, assessing circulating SHBG concentrations in tandem with SHBG genetic variants gives a better measure of metabolic susceptibility than either biochemical or genetic markers alone. Several strengths enhanced the present findings validity. The study high credibility was strengthened by a relatively large, well-characterized cohort encompassing healthy controls, individuals with insulin resistance, and patients with T2DM. Furthermore, SHBG polymorphisms had been integrated within the same analytical framework, in addition to all comprehensive biochemical phenotyping with genetic analysis. Another strengthen factor was the robustness of the findings through the application of multivariable regression models together with ROC curve analysis. However, certain limitations should be mentioned here, where the case-control design precluded causal inference, generalizability to other populations and this may reflect variations in allele frequencies, genetic background, environmental exposures, dietary habits, obesity prevalence, and lifestyle characteristics across different ethnic populations; due to using the single-center recruitment, and only two SHBG polymorphisms were evaluated despite the possibility that additional variants and gene-gene interactions also contribute to SHBG regulation. Moreover, unmeasured lifestyle factors, including physical activity and dietary habits represent a residual confounding from, which cannot be completely excluded (35). As a result, to validate these findings and further clarify the molecular mechanisms linking SHBG genetic variation with metabolic dysfunction a large multicenter prospective studies involving ethnically diverse populations are required (36).
5. Conclusion
A strong association between decreased plasma SHBG concentrations, genetic variation in SHBG and progression from insulin resistance to T2DM was suggested in this study. The stratification of metabolic risk by combining biochemical with genetic information could be enhanced and offering many new insights and into the biological pathways linked to diabetes susceptibility. Additionally, predicting insulin resistance and type 2 diabetes mellitus through measuring the hormone level; where lowering this hormone is proportionally correlated with these metabolic changes. On the other hand, these polymorphisms (i.e., rs1799941 and rs6257) were independently associated with circulating SHBG levels and T2DM susceptibility, and there was no noticeable interaction between the two variants. Therefore, the utility of serum SHBG measurement in conjunction with SHBG genotyping could be used to identify individuals at increased risk for metabolic dysfunction. These observations need validation from further prospective studies. A good discrimination of T2DM was achieved by measuring serum SHBG which may be a novel promising discriminator biomarker for assessing metabolic risk. Also, the associations between SHBG polymorphisms and circulating concentrations of SHBG as well as metabolic status indicate genetic information may benefit personal risk stratification. However, interventional studies are required to confirm these observations and to assess whether SHBG biochemical and genetic assays could be involved into routine clinical practice by adding incremental prediction above and beyond established clinical and biochemical parameters.
6. Declarations
6.1 Acknowledgments
Authors would like to sincerely thank the staff of both Diabetes and Endocrinology Center, Al-Sadr Medical City, Najaf Health Directorate and Department of Biochemistry, College of Medicine - University of Kufa for their help in this study providing technical support and cooperation.
6.2 Ethical Considerations
The protocol was approved after agreement from the Scientific and Ethical Committee of the College of Pharmacy, Jabir Ibn Hayyan Medical University for Medical and Pharmaceutical Sciences, Najaf, Iraq.
6.3 Authors' Contributions
Mohammed Noori Salman, Methodology, Investigation and Data Curation, Formal Analysis: Conceptualization. Writing- Original Draft & Writing- Review & Editing. Hazim Ali Hussein (Methodology, Supervision, Validation, Writing-Review & Editing) Abdulhussein Alwan Algenabi: Investigation, Resources, Data curation, Writing-Review & Editing All authors reviewed and approved the final manuscript.
6.4 Conflict of Interest
The authors declare that they have no conflicts of interest
6.5 Fund or Financial Support
No specific funding from any agency.
6.6 Using Artificial Intelligence Tools (AI Tools)
The authors were not utilized AI Tools.
Type of Study: Original Research Article |
Subject:
Clinical Medicine
Received: 2026/04/9 | Accepted: 2026/06/15 | Published: 2026/06/29
Received: 2026/04/9 | Accepted: 2026/06/15 | Published: 2026/06/29
References
1. International Diabetes Federation. IDF and Sun Life partner to support type 2 diabetes risk reduction [Internet]. Brussels: International Diabetes Federation; 2026. Available from: IDF news article
2. Khan MAB, Hashim MJ, King JK, Govender RD, Mustafa H, Al Kaabi J. Epidemiology of type 2 diabetes: global burden of disease and forecasted trends. J Epidemiol Glob Health. 2020;10(1):107-11. [DOI:10.2991/jegh.k.191028.001] [PMID]
3. Zhao X , An X , Yang Ch, Sun W, Ji H , Lian F . The crucial role and mechanism of insulin resistance in metabolic disease. Front Endocrinol (Lausanne). 2023;14 [DOI:10.3389/fendo.2023.1149239] [PMID] [PMCID]
4. Petra PH. The plasma sex steroid binding protein (SBP or SHBG). A critical review of recent developments on the structure, molecular biology and function. J Steroid Biochem Mol Biol. 1991; 40:735-53. [DOI:10.1016/0960-0760(91)90299-K] [PMID]
5. Szybiak-Skora W, Cyna W, Lacka K. New insights in the diagnostic potential of sex hormone-binding globulin (SHBG)-clinical approach. Biomedicines. 2025;13(5):1207. [DOI:10.3390/biomedicines13051207] [PMID] [PMCID]
6. Sepu N, Adeleye JO, Kuti MO. Serum testosterone in Nigerian men with type 2 diabetes mellitus and its relationship with insulin sensitivity and glycemic control. J Natl Med Assoc. 2021;113(3):285-93. [DOI:10.1016/j.jnma.2020.11.014] [PMID]
7. Paruk IM, Pirie FJ, Nkwanyana NM, Motala AA. Prevalence of low serum testosterone levels among men with type 2 diabetes mellitus attending two outpatient diabetes clinics in KwaZulu-Natal Pro vince. South Africa S Afr Med J. 2019;109(12): 963-70. [DOI:10.7196/SAMJ.2019.v109i12.013893] [PMID]
8. Zhang J, Li X, Cai Z, Li H, Yang B. Association between testosterone with type 2 diabetes in adult males, a meta-analysis and trial sequential analysis. Aging Male. 2020 ;23(5):607-18. [DOI:10.1080/13685538.2018.1557139] [PMID]
9. Franciele Porgere I, Martins Rocha B, Monteiro Escott G, Carolina Fagundes Silva L, Aparecida Correa Freitas P, Satleret F et al. Association of age and insulin resistance with sex hormone-binding globulin levels in healthy men. Arch Endocrinol Metab. 2025;69(4): e240360 [DOI:10.20945/2359-4292-2024-0360] [PMID] [PMCID]
10. Aydin B, Winters SJ. Sex hormone-binding globulin and metabolic syndrome in children and adolescents: a focus on puberty. Metabolites. 2025;15(8):494. [DOI:10.3390/metabo15080494] [PMID] [PMCID]
11. White MJ, Eren F, Agirbasli D, Williams SM. SHBG gene polymorphism (rs1799941) associates with metabolic syndrome in children and adolescents. PLoS One. 2015;10(2): e0116915. [DOI:10.1371/journal.pone.0116915] [PMID] [PMCID]
12. Ponomarenko M, Reshetnikov E, Churnosova M, Aristova I, Abramova M, Novakov V, et al. Genetic variants linked with the concentration of sex hormone-binding globulin correlate with uterine fibroid risk. Life (Basel). 2025;15(7):1150. [DOI:10.3390/life15071150] [PMID] [PMCID]
13. Nadhum Jawad Musafer K, Ali A, Ahmad Damitri Al Astani T, Mohammed Arafat H, Irfan Abdul Jalal M, Nor Arifin W,et al. Genetic variants associated with type 2 diabetes mellitus: a meta-analysis of Egyptian and Levant populations. Diabetol Metab Syndr. 2026;18:111 [DOI:10.1186/s13098-026-02103-5] [PMID] [PMCID]
14. American Diabetes Association Professional Practice Committee. Diagnosis and classification of diabetes: Standards of Care in Diabetes-2025. Diabetes Care. 2025;48(Suppl 1): S27-S40.
15. Gayoso-Diz P, Otero-González A, Rodriguez-Alvarez MX, Gude F, García F, De Francisco A, Quintela AG. Insulin resistance (HOMA-IR) cut-off values and the metabolic syndrome in a general adult population: effect of gender and age: EPIRCE cross-sectional study. BMC Endocr Disord. 2013;13:47. [DOI:10.1186/1472-6823-13-47] [PMID] [PMCID]
16. Bourebaba N , Ngo T , Śmieszek A , Bourebaba L , Marycz K. Sex hormone binding globulin as a potential drug candidate for liver-related metabolic disorders treatment. Biomed Pharmacother. 2022; 153:113261. [DOI:10.1016/j.biopha.2022.113261] [PMID]
17. Shaherawala J, Mangukiya K. Study of various glycolytic inhibitors for preservation of blood glucose and clinical biochemical parameters.Int J Biochem Res. 2019;6(4):535-38 [DOI:10.18231/j.ijcbr.2019.112]
18. Dagur PK, McCoy JP Jr. Collection, storage, and preparation of human blood cells. Curr Protoc Cytom. 2015; 73:5.1.1-5.1.16. [DOI:10.1002/0471142956.cy0501s73] [PMID] [PMCID]
19. Jiang Z, Lu Y, Shi M, Li H, Duan J, Huang J. Effects of storage temperature, storage time, and hemolysis on the RNA quality of blood specimens: a systematic quantitative assessment. Heliyon. 2023;9: e16234. [DOI:10.1016/j.heliyon.2023.e16234] [PMID] [PMCID]
20. Chang J, Choi S, Cho H, Kim S, Chung JW, Yoo SJ, et al. Standards and practice guidelines for venous blood collection: consensus recommendations from the Korean Society for Laboratory Medicine. Ann Lab Med. 2025;45(4):343-57. [DOI:10.3343/alm.2025.0022] [PMID] [PMCID]
21. Roche Diagnostics. COBAS INTEGRA® 400 plus Operator's Manual.Mannheim, Germany: Roche Diagnostics.
22. Sherry ST, Ward MH, Kholodov M, Baker J, Phan L, Smigielski EM,et al. dbSNP: the NCBI database of genetic variation. Nucleic Acids Res. 2001;29(1):308-11. [DOI:10.1093/nar/29.1.308] [PMID]
23. Mansoori B, Liang C. Protocol for rapid allelic discrimination qPCR genotyping of the Winnie mouse model. STAR Protoc. 2026;7(2):104497. [DOI:10.1016/j.xpro.2026.104497] [PMID] [PMCID]
24. Fodor Duric L, Čolak Romić Z, Pavičić D, Čurić J, Belčić V, Rajković I, et al. The role of sex hormone-binding globulin (SHBG) as a marker of metabolic dysfunction-associated steatotic liver disease, with an extended analysis in both men and women. J Clin Med. 2026;15(3):1301. [DOI:10.3390/jcm15031301] [PMID] [PMCID]
25. Ding EL, Song Y, Manson JE, Hunter DJ, Lee CC, Rifai N, et al. Sex hormone-binding globulin and risk of type 2 diabetes in women and men. N Engl J Med. 2009; 361(12):1152-63. [DOI:10.1056/NEJMoa0804381] [PMID]
26. Narinx N, David K, Walravens J, Vermeersch P, Claessens F, Fiers T,et al. Role of sex hormone-binding globulin in the free hormone hypothesis and the relevance of free testosterone in androgen physiology. Cell Mol Life Sci. 2022; 79(11):543. [DOI:10.1007/s00018-022-04562-1] [PMID] [PMCID]
27. Le TN, Nestler JE, Strauss JF, Wickham EP. Sex hormone-binding globulin and type 2 diabetes mellitus. Trends Endocrinol Metab. 2012;23(1):32-40. [DOI:10.1016/j.tem.2011.09.005] [PMID] [PMCID]
28. Komurcu-Bayrak E. Impact of genetic polymorphisms on insulin resistance. In Tech; 2012. [DOI:10.5772/51595]
29. Perry JRB, Weedon MN, Langenberg C, Jackson AU, Lyssenko V, Sparsø T, et al. Genetic evidence that raised sex hormone-binding globulin levels reduce the risk of type 2 diabetes. Hum Mol Genet. 2010;19(3):535-44. [DOI:10.1093/hmg/ddp522] [PMID] [PMCID]
30. Chen C, Smothers J, Lange A, Nestler JE, Strauss JF III, Wickham EP III. Sex hormone-binding globulin genetic variation: associations with type 2 diabetes mellitus and polycystic ovary syndrome. Minerva Endocrinol. 2010;35(4):271-80.
31. Quan L, Wang L, Wang J, Yuwen B, Zhang J. Association between sex hormone-binding globulin gene polymorphism and type 2 diabetes mellitus. Int J Clin Exp Pathol. 2019;12(9):3514-20.
32. Huang R, Wang Y, Yan R, Ding B, Ma J. Sex hormone-binding globulin is an independent predictor for insulin resistance in male patients with newly diagnosed type 2 diabetes mellitus. Diabetes Ther. 2023;14(8):1627-37. [DOI:10.1007/s13300-023-01445-x] [PMID] [PMCID]
33. White MJ, Eren F, Agirbasli D, Williams SM, Agirbasli M. SHBG gene polymorphism (rs1799941) associates with metabolic syndrome in children and adolescents. PLoS One. 2015;10(2): e0116915. [DOI:10.1371/journal.pone.0116915] [PMID] [PMCID]
34. Sunbul M, Eren F, Nacar C, Agirbasli D. Sex hormone-binding globulin gene polymorphisms and metabolic syndrome in postmenopausal Turkish women. Cardiol J. 2013;20(3):287-93 [DOI:10.5603/CJ.2013.0074] [PMID]
35. Longcope C, Feldman HA, McKinlay JB, Araujo AB. Diet and sex hormone-binding globulin. J Clin Endocrinol Metab. 2000;85(1):293-96. [DOI:10.1210/jcem.85.1.6291] [PMID]
36. AlAnazi M, Flores Ventura E, Lovegrove J, Santhanakrishnan Vimaleswaran K. A systematic review of the gene-lifestyle interactions on metabolic disease-related outcomes in Arab populations. Nutrients. 2024;16(15):2519. [DOI:10.3390/nu16152519] [PMID] [PMCID]
Send email to the article author
| Rights and permissions | |
 |
This work is licensed under a Creative Commons Attribution-NonCommercial 4.0 International License. |
Copyright Policy
Journal of Advances in Medical and Biomedical Research by Zanjan University of Medical Sciences is licensed under CC BY-NC 4.0