
Sun, Nov 8, 2026
[Archive]
Volume 34, Issue 4 (July & August 2026)
J Adv Med Biomed Res 2026, 34(4): 388-400 |
Back to browse issues page


Ethics code: 90/90-392-01


Download citation:
BibTeX | RIS | EndNote | Medlars | ProCite | Reference Manager | RefWorks
Send citation to:


BibTeX | RIS | EndNote | Medlars | ProCite | Reference Manager | RefWorks
Send citation to:
Sadat Hajimiri E, Shapouri R, Zeighami H, Shokoohizadeh L. Uropathogenic Escherichia coli in Intensive Care Unit Patients: High Genetic Diversity, Multidrug Resistance, and Frequent Pathogenicity Islands Revealed by Pulsed Field Gel Electrophoresis. J Adv Med Biomed Res 2026; 34 (4) :388-400
URL: http://journal.zums.ac.ir/article-1-7999-en.html
URL: http://journal.zums.ac.ir/article-1-7999-en.html


1- Department of Microbiology, Zanjan Branch, Islamic Azad University, Zanjan, Iran
2- Department of Microbiology, Zanjan Branch, Islamic Azad University, Zanjan, Iran ,reza.shapouri@iau.ac.ir
3- Department of Microbiology, School of Medicine, Zanjan University of Medical Sciences, Zanjan, Iran
4- Department of Microbiology, School of Medicine, Hamadan University of Medical Sciences, Hamadan, Iran
2- Department of Microbiology, Zanjan Branch, Islamic Azad University, Zanjan, Iran ,
3- Department of Microbiology, School of Medicine, Zanjan University of Medical Sciences, Zanjan, Iran
4- Department of Microbiology, School of Medicine, Hamadan University of Medical Sciences, Hamadan, Iran
Keywords: Molecular Epidemiology, Uropathogenic Escherichia coli, Antibiotics Resistance, Pulsed-Field Gel Electrophoresis
Full-Text [PDF 667 kb]
(89 Downloads)
| Abstract (HTML) (611 Views)
1. Introduction
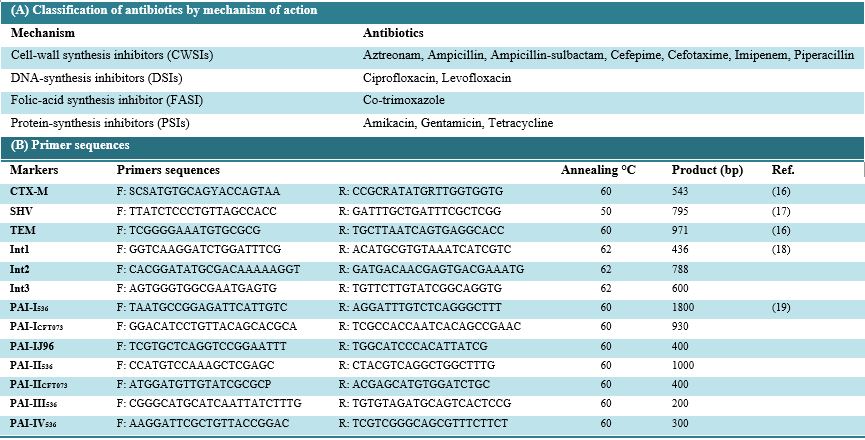
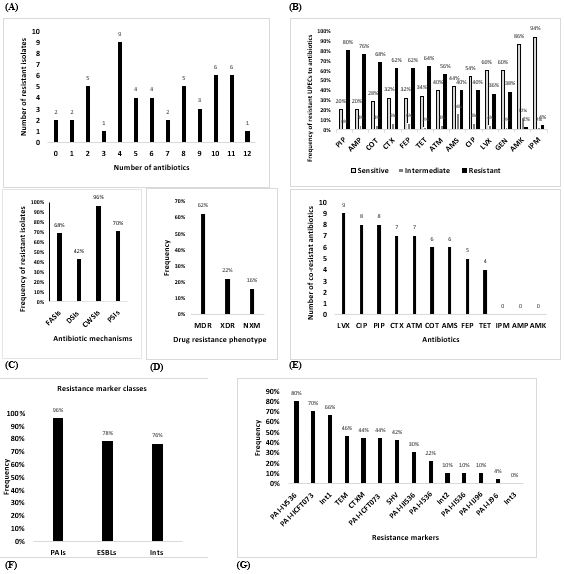
Figure 1. Findings of antibiotic susceptibility tests and frequency of b-lactamases, integrons, and PAI markers in isolates. The number of resistant isolates and antibiotics (A). Frequency of resistant UPECs to antibiotics (B). Frequency of resistant isolates to mechanisms of antibiotics (C). Frequency of MDR, XDR, and non-XDR MDR (NXM) isolates (D). The occurrence of co-resistance to antibiotics (E). Frequency of resistance marker classes (F). Frequency of resistance markers (G).
Table 2. (A): The frequency of co-resistance to antibiotics in UPEC isolates. (B): Co-existence of resistance markers and marker classes. (C): Interaction between marker classes and resistance to antibiotic classes.
2A
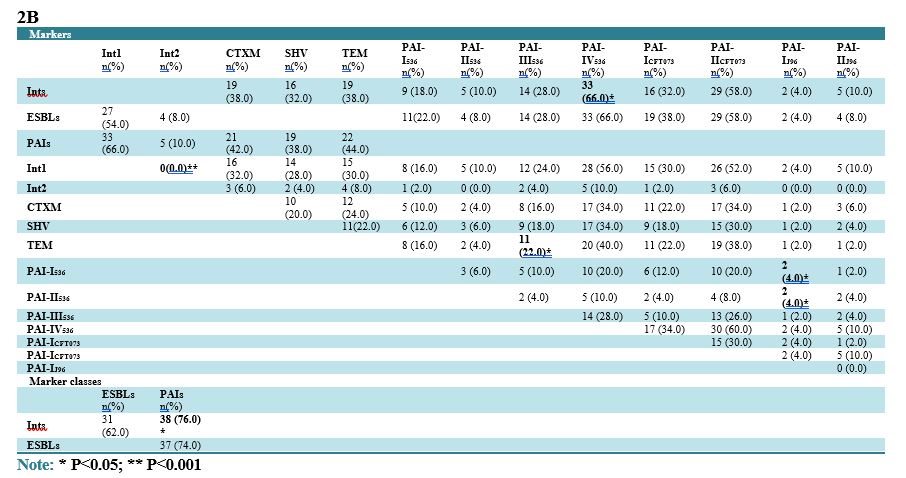
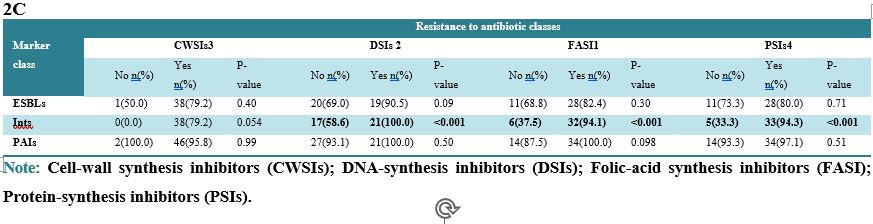
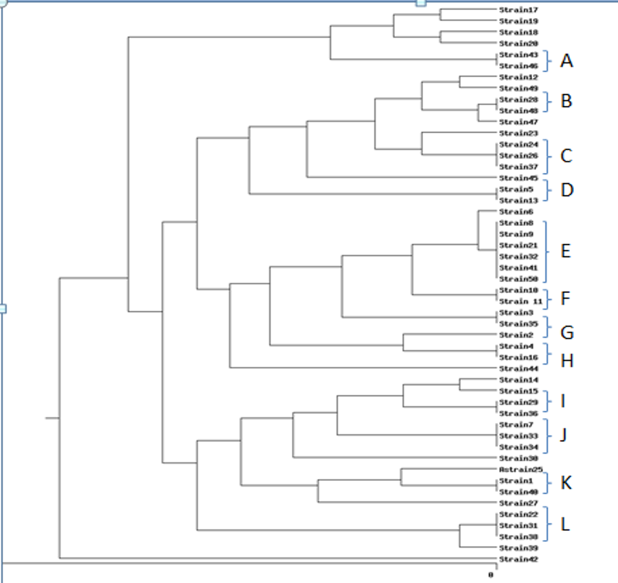
Figure 2. Dendrogram of PFGE patterns. As depicted here 12 common types and 26 single types have been identified.
Table 3. (A): Interaction of markers with the frequency of antibiotic resistance. (B): Frequency of resistance markers in MDR and XDR UPEC isolates.
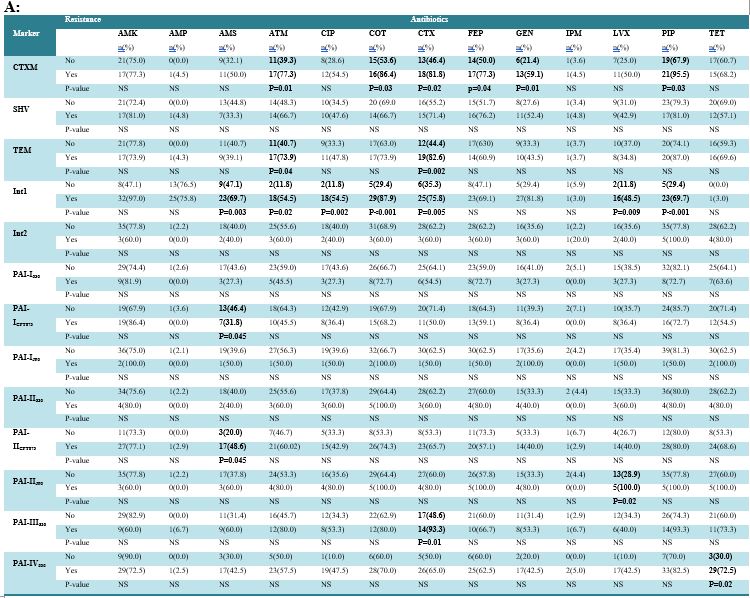
Note: NS: non-significant. Amikacin (AMK), Ampicillin (AMP), Ampicillin-sulbactam (AMS), Aztreonam (ATM), Cefepime (FEP), Cefotaxime (CTX), Ciprofloxacin (CIP), Cotrimoxazole (COT), Gentamicin (GEN), Imipenem (IPM), Levofloxacin (LVX), Piperacillin (PIP) Tetracycline (TET).
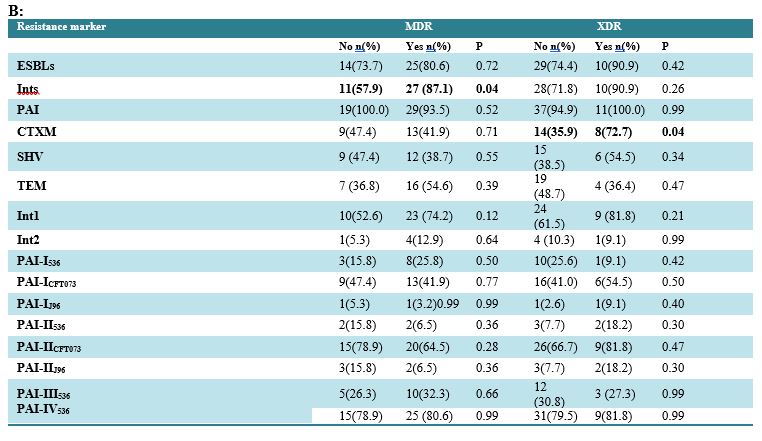
Table 4. Frequency of markers and AR in different identified PFGE clusters.
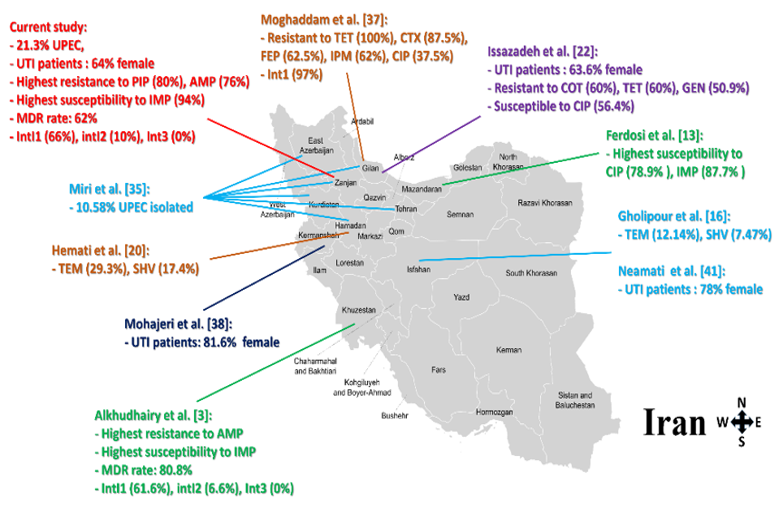
Figure 3. Geographical regions of discussed studies. The figure depicts markers and resistance distribution reported from the different areas of the country.
Full-Text: (40 Views)
1. Introduction
Escherichia coli is a commensal species of the facultative anaerobic microbiota in the human large intestine; however, pathogenic strains of E. coli are responsible for nosocomial and community-acquired infections, particularly urinary tract infections (UTIs). Urinary tract infection is the most prevalent form of hospital-acquired infection (HAIs). Hospital-acquired UTIs are related to prolonged hospitalization and higher healthcare expenditures, which may lead to serious infections such as urosepsis and septic shock. Uropathogenic Escherichia coli (UPEC) is a main causative agent of UTI, responsible for 75% of uncomplicated UTIs and roughly 65% of complicated UTIs (1-3).
The rise of antimicrobial-resistant E. coli, especially multidrug-resistant strains, constitutes a serious global public health issue. The widespread use of antimicrobial agents in human and veterinary medicine correlates with the emergence of resistance to medicinal treatments. Furthermore, the horizontal transmission of gene cassettes appears to be the main cause of the rapid spread of antibiotic resistance among bacteria. The acquisition and loss of functional modules like integrons also play a crucial role in the rapid evolution of bacterial resistance. The spread of resistance among E. coli strains has diminished the efficacy of the first-line antimicrobial agents used for UTI like trimethoprim-sulfamethoxazole, leading to a heightened need for newer broad-spectrum drugs, like fluoroquinolones and extended-spectrum cephalosporins (3-5).
Extended-spectrum beta-lactamases (ESBLs) are heterogeneous and rapidly evolving enzymes that confer resistance to various types of beta-lactam antibiotics, including penicillins, cephalosporins, and aztreonam. ESBLs encompass various groups, with the CTX-M, TEM, and SHV being the most dominant ESBLs worldwide. The genes encoding ESBLs are typically located on mobile plasmids that can harbor other resistance genes. ESBL-producing E. coli poses a serious public health threat as these ESBL genes can disseminate using plasmid-mediated integrons, insertion sequence (IS) elements, and transposons among various bacterial species (6-8).
Integrons and genetic cassettes are significant risk factors in the emergence of antibiotic resistance in UPEC isolates. They have a significant role in the acquisition, expression, and spread of resistance genes throughout bacterial populations. Previous studies on UPEC have demonstrated a significant correlation between integron presence and antibiotic resistance in various regions of Asia, Europe, and the United States (9-11).
The pathogenicity of UPEC strains arises from the presence of virulence genes located on the chromosome or plasmids, which are rare in commensal E. coli strains. Virulence genes on the chromosome are generally located in specific regions known as pathogenicity islands (PAIs). Evidence indicates that variations in virulence between pathogenic and nonpathogenic bacterial strains can be partially attributed to virulence genes located in PAIs. PAIs are unique genetic elements of bacterial pathogens that encode a range of virulence factors, including protein secretion systems, host invasion factors, iron uptake systems, and toxins. PAIs are often flanked by repeated sequences and contain numerous fragments of other mobile and accessory genetic elements, including bacteriophages, plasmids, and insertion sequence (IS) elements. The eight most studied PAI markers in UPEC are PAI I–IV in E. coli 536, PAI I and II in E. coli CFT073, and PAI I and II in E. coli J96 (12-13).
Molecular typing techniques are commonly used to determine the clonal relationships among bacterial strains. Pulsed-field gel electrophoresis (PFGE) is a specialized agarose gel electrophoresis method that separates very large DNA fragments and may differentiate bacteria at the subspecies level by using alternating timed flow directions to separate megabase-sized fragments (14-15).
Although previous studies in Iran have reported the prevalence of ESBL-producing E. coli and integrons in various clinical settings, comprehensive data integrating antibiotic resistance patterns, ESBL genotypes (blaCTX-M, blaSHV, blaTEM), integron classes (intI I–III), and pathogenicity island (PAI) markers simultaneously in a single UPEC population remain scarce. Moreover, to the best of our knowledge, no study has yet investigated the molecular epidemiology and clonal relatedness of UPEC isolates using Pulsed-Field Gel Electrophoresis (PFGE) specifically among catheterized patients with urinary tract infections in Zanjan province. Given the geographical and demographic specificities of this region, as well as the potential differences in antibiotic prescription policies and nosocomial transmission dynamics, the distribution of these genetic determinants and their association with multidrug resistance cannot be extrapolated from studies conducted in other parts of Iran or abroad. Therefore, this study aimed to investigate the antibiotic susceptibility pattern, the frequency of blaCTX-M, blaSHV, and blaTEM types of ESBLs, integrons genes intI I, intI II, and intI III, and PAI markers PAI I536, PAI II536, PAI III536, PAI IV536, PAI ICFT073, PAI IICFT073, PAI IJ96 and PAI IIJ96 among E. coli isolated from catheterized patients with UTI symptoms in Zanjan, as well as the genetic relationship between these isolates using PFGE.
2. Materials and Methods
2.1 Isolation and detection of UPEC strains
In this cross-sectional study, between March 2021 and February 2022, a total of 71 urine samples were aseptically collected from catheterized patients with UTI symptoms hospitalized in three major university hospitals in Zanjan, northwest Iran, using sterile syringes after disinfecting the catheter port with 70% ethanol. Urine samples were immediately transported to the microbiology laboratory and cultured on MacConkey agar and Blood agar (Merck, Darmstadt, Germany) and incubated overnight at 37°C. E. coli isolates were identified according to the standard biochemical tests as described previously. Verified UPEC isolates were preserved at −80°C in Trypticase Soy broth (Merck) containing 20% (v/v) glycerol for further analysis.
2.2 Antibiotic susceptibility testing
The susceptibility of isolates to the following 13 antibiotics was assessed by the disk diffusion method on Mueller-Hinton agar, in accordance with Clinical and Laboratory Standards Institute (CLSI) standards: Amikacin (AMK 30 μg), Ampicillin (AMP 10 μg), Ampicillin-sulbactam (AMS 20 μg), Aztreonam (ATM 30 µg), Ciprofloxacin (CIP 5 μg), Trimethoprim-sulfamethoxazole (COT 25 µg), Cefotaxime (CTX 30 μg), Cefepime (FEP 30 μg), Gentamicin (GEN 10 μg), Imipenem (IPM 10 μg), Levofloxacin (LVX 5 µg), Piperacillin (PIP 100 μg), and Tetracycline (TET 30 μg). Multidrug-resistant (MDR) E. coli was considered an isolate that was resistant to at least one agent in three or more classes of antimicrobial agents. Extensively drug-resistant (XDR) E. coli was defined as an isolate that was resistant to at least one agent in all but two or fewer antimicrobial agents. E. coli ATCC 25922 was used as the quality control of susceptibility testing (Table 1A).
Table 1. Primers and different classes of antibiotics used in this study.
2.3 DNA extraction
DNA extraction from UPEC isolates was performed according to the protocol provided with the GeneAll ExgeneTM Cell SV kit (GeneAll Biotechnology, Korea). The quantity and quality of extracted DNA were determined using a NanoDrop Spectrophotometer (ND-1000, NanoDrop Technologies, Wilmington, DE) and agarose gel electrophoresis, respectively.
2.4 Detection of ESBLs, integrons and PAI markers in UPEC isolates
The presence of blaCTX-M, blaSHV, and blaTEM types of ESBLs, integron genes intI I, intI II, and intI III, and PAI markers PAI I536, PAI II536, PAI III536, PAI IV536, PAI ICFT073, PAI IICFT073, PAI IJ96 and PAI IIJ96 was determined using specific primers listed in Table 1B. PCR was conducted utilizing DreamTaq PCR Master Mix (Ampliqon, Denmark), comprising Taq polymerase, dNTPs, MgCl2, and the appropriate buffer. Each PCR tube contained a total volume of 25 µl of reaction mixture, which included 12.5 µl of master mix, 1.5 µl of each forward and reverse primer solution (final concentration of 200 nM) (Metabion, Germany), 1 µl of DNA at a concentration of 200 ng/µl, and enough nuclease-free water to reach the final volume. PCR was conducted using the Gene Atlas 322 equipment (ASTEC, Japan). Table 1B shows the oligonucleotide primers, marker genes, and amplification conditions. The amplified DNA was separated using submerged gel electrophoresis, stained with Safe DNA Gel Stain, and observed under UV transillumination (UVITEC, UK).
2.5 Pulsed-field gel electrophoresis clustering
Genotyping of UPEC isolates was performed by PFGE using the Bio-Rad CHEF-DR III electrophoresis unit and Bio-Rad gel documentation system with a UV transilluminator. PFGE typing of isolates was performed according to the standardized DC PulseNet protocol using Xba I restriction endonuclease enzyme cleavage. Salmonella Braenderup (H9812), the universal standard strain, was used for molecular weight and size determination. PFGE agarose plugs were prepared, bacterial cells were lysed in the plugs, restriction enzyme-mediated DNA cleavage was performed in the plugs, and gel casting plug slice loading, and electrophoresis were performed in accordance with the protocol guidelines. Fingerprints with at least three distinct bands were considered as different pulsotypes. A dendrogram of PFGE patterns was constructed using the unweighted pair-group method with arithmetic mean (UPGMA) with a position tolerance of 1.2%. PFGE patterns were defined by groups of bands that formed at least 85% Dice similarity cutoffs on the dendrogram.
2.6 Statistical analysis
We analyzed and clustered the band patterns obtained from PFGE using the online software (inslico.hue.es). The software employed the Dice method for band comparison and UPGMA for clustering. A dendrogram was generated based on the Dice coefficient and UPGMA, illustrating genetic similarities with the highest correlation. In this approach, an 85% similarity cutoff was set for the bands. Data were analyzed using SPSS software version 26.0. For the qualitative variables, frequencies and percentages were reported. Associations between the quantitative variables were investigated by Fisher's exact test, the Chi-square test and the Phi test. A P-value <0.05 was considered statistically significant.
3. Result
3.1 Bacterial isolates
A total of 50 (70.4%) UPEC isolates were obtained from 71 urine samples. The overall frequency of UPEC among complicated UTI cases was 70.4%. Of the 50 UPEC isolates, 64% were detected in women and 36% in men. The mean age of patients was 40.18 years, with the highest incidence of UTI (32%) observed in the 40–60-year age group.
3.2 Antibiotic susceptibility patterns
The antibiotic susceptibility of UPEC was assessed using different antibiotic classes. All of the isolates were susceptible to at least one of the tested antibiotics. Two isolates (4%) were sensitive to all antibiotics. Among the 50 UPEC isolates, 94% were susceptible to imipenem (n= 47), 86% to amikacin (n= 43), 60% to gentamicin (n= 30) and 60% to levofloxacin (n= 30). The least effective antibiotics were piperacillin, ampicillin and trimethoprim/sulfamethoxazole, with resistance rates of 80% (n= 40), 76% (n=38) and 68% (n= 34), respectively. None of the isolates was resistant to all of the tested antibiotics, and bacteria were susceptible to at least one of the antibiotics. Two of the isolates (4%) were susceptible to all antibiotics, and one of them was resistant to 12 of them (2%). However, resistance to four antibiotics was the highest mode of resistance (18%) among the isolates (Figure 1A). The highest susceptibility was found to AMK and IPM, and the highest resistance rate was seen to AMP, COT, and PIP. All antibiotics, except PIP, showed intermediate effects on bacteria (Figure 1B). The highest intermediate effect was seen for AMS (16%) and AMK (12%) (Figure 1B). As depicted in Figure 1C, the highest frequency of resistance (96%) was observed against antibiotics that disrupt cell wall synthesis, and the lowest frequency (42%) was identified for inhibitors of DNA synthesis. Also, there was no significant difference in AR among mechanism groups of antibiotics across different ages and genders (p>0.05). 62% of UPEC isolates were MDR and 22% were XDR.
3.3 MDR and XDR profiles
As depicted in Figure 1D, 62% of isolates were MDR and 22%, and 16% of them were XDR and NXM, respectively. The frequency of resistance to antibiotics in MDR, XDR, and NXM type of bacteria are represented in Table 2A. In comparison with non-MDR isolates (XDRs + NXMs), XDR isolates were significantly more resistant to DSIs (P<0.001). Also, resistance against FASI, CWSIs, and PSIs classes was significantly lower in NXM bacteria in comparison to non-NXM isolates (MDRs+XDRs) (P<0.001). Resistance against AMK and LVX in non-MDR isolates (XDRs+NXMs) was significantly higher than its occurrence in MDR isolates (P<0.001). However, MDR bacteria were more resistant to PIP in comparison to non-MDRs (MDRs+ XMs) (P<0.001). Also, XDR bacteria were significantly more resistant than non-XDRs against AMK, AMS, ATM, CIP, FEP, GEN, and LVX (P<0.001). Furthermore, considering that non-NXM bacteria were a collection of MDR and XDR isolates, resistance to FASIs, CWSIs, and PSIs was significantly higher in MDR+XDR isolates in comparison to NXM bacteria (P<0.001) (Table 2A). If we consider individual antibiotics, MDR+XDR isolates were significantly more resistant to COT, CTX, AMS, ATM, PIP, GEN, and TET in comparison to NXMs (P<0.001) (Table 2A). There was statistically significant co-resistance against all antibiotics except AMP, AMK, and IMP (P<0.001) (Table 2A). The highest number of significant co-resistances (with nine antibiotics) was seen for LVX (P<0.001) (Figure 1E). Also, regarding antibiotic classes, significant co-resistances were observed for FASI and DSIs, FASI and PSIs, and DSIs and PSIs. No significant co-resistances were found between class CWSIs and others (P<0.001) (Table 2A).
DNA extraction from UPEC isolates was performed according to the protocol provided with the GeneAll ExgeneTM Cell SV kit (GeneAll Biotechnology, Korea). The quantity and quality of extracted DNA were determined using a NanoDrop Spectrophotometer (ND-1000, NanoDrop Technologies, Wilmington, DE) and agarose gel electrophoresis, respectively.
2.4 Detection of ESBLs, integrons and PAI markers in UPEC isolates
The presence of blaCTX-M, blaSHV, and blaTEM types of ESBLs, integron genes intI I, intI II, and intI III, and PAI markers PAI I536, PAI II536, PAI III536, PAI IV536, PAI ICFT073, PAI IICFT073, PAI IJ96 and PAI IIJ96 was determined using specific primers listed in Table 1B. PCR was conducted utilizing DreamTaq PCR Master Mix (Ampliqon, Denmark), comprising Taq polymerase, dNTPs, MgCl2, and the appropriate buffer. Each PCR tube contained a total volume of 25 µl of reaction mixture, which included 12.5 µl of master mix, 1.5 µl of each forward and reverse primer solution (final concentration of 200 nM) (Metabion, Germany), 1 µl of DNA at a concentration of 200 ng/µl, and enough nuclease-free water to reach the final volume. PCR was conducted using the Gene Atlas 322 equipment (ASTEC, Japan). Table 1B shows the oligonucleotide primers, marker genes, and amplification conditions. The amplified DNA was separated using submerged gel electrophoresis, stained with Safe DNA Gel Stain, and observed under UV transillumination (UVITEC, UK).
2.5 Pulsed-field gel electrophoresis clustering
Genotyping of UPEC isolates was performed by PFGE using the Bio-Rad CHEF-DR III electrophoresis unit and Bio-Rad gel documentation system with a UV transilluminator. PFGE typing of isolates was performed according to the standardized DC PulseNet protocol using Xba I restriction endonuclease enzyme cleavage. Salmonella Braenderup (H9812), the universal standard strain, was used for molecular weight and size determination. PFGE agarose plugs were prepared, bacterial cells were lysed in the plugs, restriction enzyme-mediated DNA cleavage was performed in the plugs, and gel casting plug slice loading, and electrophoresis were performed in accordance with the protocol guidelines. Fingerprints with at least three distinct bands were considered as different pulsotypes. A dendrogram of PFGE patterns was constructed using the unweighted pair-group method with arithmetic mean (UPGMA) with a position tolerance of 1.2%. PFGE patterns were defined by groups of bands that formed at least 85% Dice similarity cutoffs on the dendrogram.
2.6 Statistical analysis
We analyzed and clustered the band patterns obtained from PFGE using the online software (inslico.hue.es). The software employed the Dice method for band comparison and UPGMA for clustering. A dendrogram was generated based on the Dice coefficient and UPGMA, illustrating genetic similarities with the highest correlation. In this approach, an 85% similarity cutoff was set for the bands. Data were analyzed using SPSS software version 26.0. For the qualitative variables, frequencies and percentages were reported. Associations between the quantitative variables were investigated by Fisher's exact test, the Chi-square test and the Phi test. A P-value <0.05 was considered statistically significant.
3. Result
3.1 Bacterial isolates
A total of 50 (70.4%) UPEC isolates were obtained from 71 urine samples. The overall frequency of UPEC among complicated UTI cases was 70.4%. Of the 50 UPEC isolates, 64% were detected in women and 36% in men. The mean age of patients was 40.18 years, with the highest incidence of UTI (32%) observed in the 40–60-year age group.
3.2 Antibiotic susceptibility patterns
The antibiotic susceptibility of UPEC was assessed using different antibiotic classes. All of the isolates were susceptible to at least one of the tested antibiotics. Two isolates (4%) were sensitive to all antibiotics. Among the 50 UPEC isolates, 94% were susceptible to imipenem (n= 47), 86% to amikacin (n= 43), 60% to gentamicin (n= 30) and 60% to levofloxacin (n= 30). The least effective antibiotics were piperacillin, ampicillin and trimethoprim/sulfamethoxazole, with resistance rates of 80% (n= 40), 76% (n=38) and 68% (n= 34), respectively. None of the isolates was resistant to all of the tested antibiotics, and bacteria were susceptible to at least one of the antibiotics. Two of the isolates (4%) were susceptible to all antibiotics, and one of them was resistant to 12 of them (2%). However, resistance to four antibiotics was the highest mode of resistance (18%) among the isolates (Figure 1A). The highest susceptibility was found to AMK and IPM, and the highest resistance rate was seen to AMP, COT, and PIP. All antibiotics, except PIP, showed intermediate effects on bacteria (Figure 1B). The highest intermediate effect was seen for AMS (16%) and AMK (12%) (Figure 1B). As depicted in Figure 1C, the highest frequency of resistance (96%) was observed against antibiotics that disrupt cell wall synthesis, and the lowest frequency (42%) was identified for inhibitors of DNA synthesis. Also, there was no significant difference in AR among mechanism groups of antibiotics across different ages and genders (p>0.05). 62% of UPEC isolates were MDR and 22% were XDR.
3.3 MDR and XDR profiles
As depicted in Figure 1D, 62% of isolates were MDR and 22%, and 16% of them were XDR and NXM, respectively. The frequency of resistance to antibiotics in MDR, XDR, and NXM type of bacteria are represented in Table 2A. In comparison with non-MDR isolates (XDRs + NXMs), XDR isolates were significantly more resistant to DSIs (P<0.001). Also, resistance against FASI, CWSIs, and PSIs classes was significantly lower in NXM bacteria in comparison to non-NXM isolates (MDRs+XDRs) (P<0.001). Resistance against AMK and LVX in non-MDR isolates (XDRs+NXMs) was significantly higher than its occurrence in MDR isolates (P<0.001). However, MDR bacteria were more resistant to PIP in comparison to non-MDRs (MDRs+ XMs) (P<0.001). Also, XDR bacteria were significantly more resistant than non-XDRs against AMK, AMS, ATM, CIP, FEP, GEN, and LVX (P<0.001). Furthermore, considering that non-NXM bacteria were a collection of MDR and XDR isolates, resistance to FASIs, CWSIs, and PSIs was significantly higher in MDR+XDR isolates in comparison to NXM bacteria (P<0.001) (Table 2A). If we consider individual antibiotics, MDR+XDR isolates were significantly more resistant to COT, CTX, AMS, ATM, PIP, GEN, and TET in comparison to NXMs (P<0.001) (Table 2A). There was statistically significant co-resistance against all antibiotics except AMP, AMK, and IMP (P<0.001) (Table 2A). The highest number of significant co-resistances (with nine antibiotics) was seen for LVX (P<0.001) (Figure 1E). Also, regarding antibiotic classes, significant co-resistances were observed for FASI and DSIs, FASI and PSIs, and DSIs and PSIs. No significant co-resistances were found between class CWSIs and others (P<0.001) (Table 2A).
Figure 1. Findings of antibiotic susceptibility tests and frequency of b-lactamases, integrons, and PAI markers in isolates. The number of resistant isolates and antibiotics (A). Frequency of resistant UPECs to antibiotics (B). Frequency of resistant isolates to mechanisms of antibiotics (C). Frequency of MDR, XDR, and non-XDR MDR (NXM) isolates (D). The occurrence of co-resistance to antibiotics (E). Frequency of resistance marker classes (F). Frequency of resistance markers (G).
3.4 Distribution of ESBLs, integrons and PAI markers in UPEC isolates
As depicted in Figure 1F, PAIs class was harbored by 96% of isolates, ESBLs class was seen in 78% of bacteria, and carriers of Int classes were less than the other two classes (76%). Regarding ESBL markers, 44% of isolates carried CTX-M, 42% of SHV, and 46% of TEM (Figure 1G). Int1 was identified in 66% of isolates, Int2 in 10%, and Int3 was found in none of the bacteria (Figure 1G). The most frequent PAI was PAI-IV536 (80%), and the lowest frequency (4%) was observed for the PAI-IJ96 (Figure 1G). The presence of marker classes and individual markers was not significantly associated with gender and age of patients (p>0.05). Significant co-existence of resistance markers in bacteria was found for
Int1 and Int2, TEM and PAI-III536, PAI-I536, and PAI-IJ96, PAI-II536, and PAI-IJ96 (Table 2B). Significant co-existence was seen for the Ints class and PAI-IV536 (Table 2B) and Ints and PAIs (Table 2B).
3.5 PFGE clustering
PFGE clustering identified 38 distinct pulsotypes among the 50 UPEC isolates (Figure 2), of which 12 were common types (CTs) and 26 were single types (STs). This indicates that there is a high genetic diversity among the isolates. Among CTs, types A, B, D, F, G, H, I, and K were composed of two isolates, types L, J, and C each had three members, and type E the largest group, had seven isolates.
As depicted in Figure 1F, PAIs class was harbored by 96% of isolates, ESBLs class was seen in 78% of bacteria, and carriers of Int classes were less than the other two classes (76%). Regarding ESBL markers, 44% of isolates carried CTX-M, 42% of SHV, and 46% of TEM (Figure 1G). Int1 was identified in 66% of isolates, Int2 in 10%, and Int3 was found in none of the bacteria (Figure 1G). The most frequent PAI was PAI-IV536 (80%), and the lowest frequency (4%) was observed for the PAI-IJ96 (Figure 1G). The presence of marker classes and individual markers was not significantly associated with gender and age of patients (p>0.05). Significant co-existence of resistance markers in bacteria was found for
Int1 and Int2, TEM and PAI-III536, PAI-I536, and PAI-IJ96, PAI-II536, and PAI-IJ96 (Table 2B). Significant co-existence was seen for the Ints class and PAI-IV536 (Table 2B) and Ints and PAIs (Table 2B).
3.5 PFGE clustering
PFGE clustering identified 38 distinct pulsotypes among the 50 UPEC isolates (Figure 2), of which 12 were common types (CTs) and 26 were single types (STs). This indicates that there is a high genetic diversity among the isolates. Among CTs, types A, B, D, F, G, H, I, and K were composed of two isolates, types L, J, and C each had three members, and type E the largest group, had seven isolates.
Table 2. (A): The frequency of co-resistance to antibiotics in UPEC isolates. (B): Co-existence of resistance markers and marker classes. (C): Interaction between marker classes and resistance to antibiotic classes.
2A
| GEN n(%) | TET n(%) | AMK n(%) | AMP n(%) | PIP n(%) |
ATM n(%) | AMS n(%) | FEP n(%) | CTX n(%) | IPM n(%) | CIP n(%) | LVX n(%) |
Antibiotics | |
| 17(34.0) | 26(52.0)* | 1 (2.0) | 26(52.0) | 32(64.0)** | 24 (48.0) | 18(36.0)* | 23(46.0) | 26(52.0)* | 1(2.0) | 18(36.0)* | 16(32.0%)* | COT | |
| 15(30.0)* | 16(32.0)* | 1 (2.0) | 12(24.0) | 18 (36.0)* | 17(34.0)** | 13(26.0)* | 17(34.0)* | 17(34.0)* | 1(2.0) | 17 (34)* | LVX | ||
| 16(32.0)* | 18 (36.0) | 1 (2.0) | 14(28.0) | 20 (40.0)* | 20(40.0)** | 13(26.0)* | 19(38.0)* | 20(40.0)* | 1(2.0) | CIP | |||
| 1 (2.0) | 2 (4.0) | 1 (2.0) | 0 (0.0) | 2 (4.0) | 1 (2.0) | 1 (2.0) | 2 (4.0) | 1 (2.0) | IPM | ||||
| 18 (36.0) | 23 (46.0) | 1 (2.0) | 22(44.0) | 30(60.0)** | 28(56.0)** | 17(34.0)* | 23(46.0)* | CTX | |||||
| 16 (32.0) | 22 (44.0) | 1 (2.0) | 24(48.0) | 29 (58.0)* | 23 (46.0)* | 14 (28.0) | FEP | ||||||
| 12 (24.0) | 16 (32.0) | 1 (2.0) | 13(26.0) | 20 (40.0)* | 17 (34.0)* | AMS | |||||||
| 18(36.0)* | 22 (44.0) | 1 (2.0) | 20(40.0) | 28 (56.0) | ATM | ||||||||
| 18(36.0)* | 30(60.0)* | 1 (2.0) | 30(60.0) | PIP | |||||||||
| 13 (26.0) | 24 (48.0) | 0 (0.0) | AMP | ||||||||||
| 1 (2.0) | 1 (2.0) | AMK | |||||||||||
| 16 (32.0) | TET | ||||||||||||
Figure 2. Dendrogram of PFGE patterns. As depicted here 12 common types and 26 single types have been identified.
3.6 Interaction between markers, antibiotic resistance, and clusters
Although carriers of the Ints class were less than the other two classes (76%), they showed significant resistance to all tested classes of antibiotics except for CWSIs (Table 2C). Resistant isolates to COT, CTX, ATM, PIP, and GEN antibiotics significantly had a higher frequency of CTXM marker in comparison to susceptible bacteria. Regarding TEM, its frequency was significantly higher among resistant isolates to CTX and ATM antibiotics (Table 3A). Regarding integrons with AR-profile, in isolates resistant to COT, LVX, CIP, CTX, AMS, ATM, and PIP a significantly higher frequency of Int1 was seen. There were no significant differences between resistant and susceptible bacteria in the harboring of Int2 (p>0.05) (Table 3A). The markers PAI-I536, PAI-II536, and PAI-IJ96 were not associated with bacterial resistance to antibiotics (p>0.05). In the case of PAI-IIJ96 LVX-resistant isolates contained a significantly lower frequency of it, and its frequency was higher among LVX-susceptible bacteria. In comparison to CTX-susceptible isolates, CTX-resistant bacteria harbored a significantly higher frequency of PAI-III536 marker. TET-resistant bacteria contained a significantly higher frequency of the most frequent PAI marker (PAI-IV536) among isolates. Bacteria that were susceptible to AMS had a higher frequency of PAI-ICFT073, and conversely, the frequency of PAI-IICFT073 was significantly higher in AMS-resistant isolates (Table 3A).
There were significant results just for the Ints class and CTXM and Int1 markers (Table 3B). 87.1% of MDR isolates harbored Ints; however, with a significant difference (P= 0.04), 57.9% of non-MDR bacteria had Ints class. 12.5% of NXM isolates contained Ints class, which was significantly (P<0.001) lower than the occurrence of this class in non-NXM bacteria (88.1%). XDR bacteria contained a significantly (P=0.04) higher frequency of CTXM (72.7%) in comparison to non-XDR isolates (35.9%).
12.5% of NXM isolates harbored the Int1 marker; however, 76.2% of non-NXM bacteria contained Int1, and the difference was significant (P<0.001). The frequencies of markers (A) and resistance to antibiotics (B) in different identified clusters are represented in Table 4. Type E had the highest number of MDR and XDR UPECs.
Although carriers of the Ints class were less than the other two classes (76%), they showed significant resistance to all tested classes of antibiotics except for CWSIs (Table 2C). Resistant isolates to COT, CTX, ATM, PIP, and GEN antibiotics significantly had a higher frequency of CTXM marker in comparison to susceptible bacteria. Regarding TEM, its frequency was significantly higher among resistant isolates to CTX and ATM antibiotics (Table 3A). Regarding integrons with AR-profile, in isolates resistant to COT, LVX, CIP, CTX, AMS, ATM, and PIP a significantly higher frequency of Int1 was seen. There were no significant differences between resistant and susceptible bacteria in the harboring of Int2 (p>0.05) (Table 3A). The markers PAI-I536, PAI-II536, and PAI-IJ96 were not associated with bacterial resistance to antibiotics (p>0.05). In the case of PAI-IIJ96 LVX-resistant isolates contained a significantly lower frequency of it, and its frequency was higher among LVX-susceptible bacteria. In comparison to CTX-susceptible isolates, CTX-resistant bacteria harbored a significantly higher frequency of PAI-III536 marker. TET-resistant bacteria contained a significantly higher frequency of the most frequent PAI marker (PAI-IV536) among isolates. Bacteria that were susceptible to AMS had a higher frequency of PAI-ICFT073, and conversely, the frequency of PAI-IICFT073 was significantly higher in AMS-resistant isolates (Table 3A).
There were significant results just for the Ints class and CTXM and Int1 markers (Table 3B). 87.1% of MDR isolates harbored Ints; however, with a significant difference (P= 0.04), 57.9% of non-MDR bacteria had Ints class. 12.5% of NXM isolates contained Ints class, which was significantly (P<0.001) lower than the occurrence of this class in non-NXM bacteria (88.1%). XDR bacteria contained a significantly (P=0.04) higher frequency of CTXM (72.7%) in comparison to non-XDR isolates (35.9%).
12.5% of NXM isolates harbored the Int1 marker; however, 76.2% of non-NXM bacteria contained Int1, and the difference was significant (P<0.001). The frequencies of markers (A) and resistance to antibiotics (B) in different identified clusters are represented in Table 4. Type E had the highest number of MDR and XDR UPECs.
Table 3. (A): Interaction of markers with the frequency of antibiotic resistance. (B): Frequency of resistance markers in MDR and XDR UPEC isolates.
Note: NS: non-significant. Amikacin (AMK), Ampicillin (AMP), Ampicillin-sulbactam (AMS), Aztreonam (ATM), Cefepime (FEP), Cefotaxime (CTX), Ciprofloxacin (CIP), Cotrimoxazole (COT), Gentamicin (GEN), Imipenem (IPM), Levofloxacin (LVX), Piperacillin (PIP) Tetracycline (TET).
Table 4. Frequency of markers and AR in different identified PFGE clusters.
4. Discussion
The global threat of resistant pathogenic UPEC strains is increasing due to their high frequency of transferring virulence genes and resistance markers in these bacteria (20, 21). Studying the AR patterns and distribution of resistance markers such as ESBLs, Ints, and PAIs in UPEC isolates can provide valuable epidemiologic information and help general practitioners to prescribe effective medication against resistant UPECs (22, 23).
In this study, we have investigated patterns of resistance marker distribution and drug resistance in 50 E. coli strains isolated from 71 patients with UTIs.
The isolation rate of 70.4% UPEC among catheterized ICU patients in this study, while apparently high, is consistent with the established role of UPEC as the predominant pathogen in catheter-associated urinary tract infections (CAUTI), accounting for approximately 65-75% of complicated UTIs. The high prevalence observed may be attributed to the specific patient population (ICU setting with indwelling catheters), where the duration of catheterization and severity of underlying conditions are well-documented risk factors for infection. Previous studies have reported CAUTI prevalence rates ranging from 2.33% to 73.75%, reflecting the heterogeneity of ICU populations, infection control practices, and diagnostic criteria across different healthcare settings.
An additional limitation of this study is the lack of comprehensive clinical data regarding patients' comorbidities, including diabetes mellitus, chronic kidney disease, immunosuppressive conditions, and corticosteroid use. These factors have been identified as significant risk factors for both the development of catheter-associated urinary tract infections and the acquisition of multidrug-resistant organisms. The presence of such comorbidities could have influenced the resistance profiles observed in our UPEC isolates, as patients with underlying diseases often have longer hospital stays, more frequent antibiotic exposure, and higher rates of invasive device utilization. Future studies should incorporate detailed clinical data to enable stratified analyses of resistance patterns according to comorbidity status. Miri et al. studied E. coli pathotypes among clinical isolates from Iran (Figure 3) and reported 10.58% UPEC isolates (24). However, here we found an overall prevalence of 21.3% UPEC in the cases, which may imply the growing rate of UPEC distribution. The majority of UPEC sources (64%) in our study were female participants, and the predominant female gender with UTI. 63.6% of the UTI patients (25) (Figure 3) and 81.6% of them from Iran were females (26). The proportion in central Iran (Figure 3) was 78% females and 22% males (27). Consistent with our results, Alkhudhairy et al. recently reported the highest resistance rate to AMP in UPECs isolated from UTI patients in Iran (Figure 3). They also found the highest susceptibility rate for IMP. The rate of MDRs among our studied isolates was 62% (Figure 1D), which is lower than the 80.8% MDR rate they
identified (28). Also, a study from Babol in the north of Iran (Figure 3) showed that in UPEC from 57 urine samples, IMP and CIP were the most sensitive antibiotics at 87.7% and 78.9% rates respectively (29).
Although we also found IMP to be the most sensitive antibiotic in the current study, its frequency was slightly higher than the reported rate from Babol (Figure 3) and was detected at 94%. However, the frequency of sensitivity to CIP was much lower than that reported and was found to be 54%. Also, Issazadeh et al. reported from the north of Iran (Figure 3) that UPEC strains were highly resistant to COT 60% (68% in our study), TET 60% (same as our findings), and GEN 50.9% (38% for our isolates) while being susceptible to CIP 56.4% (54% in our study) (25). Moghaddam et al. reported that all ESBL producing UPEC isolates from the north of Iran (Figure 3) were resistant to TET (100%), CTX (87.5%), FEP (62.5%), IPM (62%) and CIP (37.5%) (30). Compared with the results of Moghaddam et al., the resistance rate to TET, CTX, and especially to IPM was lower in our studied bacteria. A study from Isfahan city, Iran (Figure 3) showed that 100% of UPEC isolates were susceptible to IPM (94% in the current study) and the rates of resistance to other antibiotics were as AMK (12.5%), GEN (14.84%), COT (25%), FEP (32%), CIP (55.46%), AMP (69.53%), and CTX (100%) (31). However, the prevalence of AR of E. coli varies from region to region in Iran (20). Co-resistance is the result of the accumulation of resistance markers to different classes of antibiotics, which happens through mutation or acquisition of novel resistance genes by horizontal transfer (32).
Considering antibiotic classes, the highest resistance was seen against CWSIs, and the highest susceptibility was found for DSIs (Figure1C). Therefore, DSIs such as ciprofloxacin and levofloxacin may still have a better antibiotic effect against UPECs. Surprisingly, Figure 1E showed that these two antibiotics represent the highest co-resistance pattern with other antibiotics. This means that, with a high likelihood, bacteria resistant to these DSIs were also resistant to many other types of antibiotics. Bourély et al. introduced co-resistance to amoxicillin and TET as an Indicator of MDR in E. coli isolated from animals (33).
Production of CTXM b-lactamases is a consequence of plasmid acquisition of the b-lactamases genes from other species. Due to the activities of these genes, some nosocomial and community-acquired infections caused by Gram-negative bacteria can now be treated with only a limited number of antibiotics (34-36). Also, it has been confirmed that the presence of Ints, especially Int1, is associated with the MDR phenotype in E. coli isolates (37-38). Furthermore, PAIs carry virulence genes and resistance markers and contain mobile genetic elements responsible for the development of UPECs (12-13).
In the central region of Iran, Isfahan (Figure 3), Gholipour et al. found the TEM and SHV genes in 12.14% and 7.47% of UPEC strains, respectively (27). Out of 92 UTI isolates from Hamadan, Iran (Figure 3), Hemati et al. reported 29.3%, and 17.4% of them possessed TEM and SHV markers, respectively (39).
However, we found that 42% of isolated UPECs from Zanjan (an adjacent province to Hamadan) contained SHV, and 46% harbored the TEM marker (Figure 3). These prevalence rates of TEM and SHV markers in the current study were remarkably higher than those reported from Isfahan (31) and Hamadan (Figure 3) (39). Alkhudhairy et al. identified IntI1, intI2, and Int3 in 61.6%, 6.6% and 0% of the UPECs isolated from UTI patients in the southwest of Iran (Figure 3), respectively (28). Likewise, we found these markers in 66%, 10%, and 0% of the isolates as well. Also, Moghaddam et al. found Int1 in 97% of UPEC in the north of Iran (Figure 3) (30). These data show that among Ints, Int1 is a more prevalent resistance marker in UPECs in different regions of the country. Here we showed that among resistant isolates to DNA synthesis inhibitors, folic acid synthesis inhibitors (Cotrimoxazole), and protein synthesis inhibitors, the frequency of Ints class was significantly higher in comparison to non-resistant bacteria to these antibiotics. As reported from UTI patients of southwest Iran, the presence of integrons was significantly associated with resistance to AMP and CIP antibiotics (28). In this study, most UPEC sources were female participants, and most isolates were resistant to antibiotics. Although the highest resistance was seen against cell wall synthesis inhibitors, no significant resistance was observed to IMP and AMP, which belong to this class. The highest susceptibility rate was found for DSIs, and therefore, agents such as ciprofloxacin and levofloxacin may still have a better antibiotic effect against UPECs. While our study provides valuable insights into the genetic diversity and resistance patterns of UPEC isolates in the Zanjan region, several limitations should be acknowledged. First, the sample size (n=50) limits the statistical power of subgroup analyses, particularly when comparing MDR versus non-MDR, XDR versus non-XDR, and resistance marker associations. Consequently, some associations that did not reach statistical significance in our analysis might become significant in larger cohorts. Second, the cross-sectional design of this study does not allow for assessment of temporal changes in resistance patterns or clonal transmission dynamics. Third, the study was conducted in a single geographical region (Zanjan province), which may limit the generalizability of our findings to other parts of Iran or other countries with different antibiotic prescription policies and epidemiological contexts. Future multi-center studies with larger sample sizes and longitudinal designs are warranted to validate these findings and to monitor the ongoing evolution of resistance determinants in UPEC populations.
The global threat of resistant pathogenic UPEC strains is increasing due to their high frequency of transferring virulence genes and resistance markers in these bacteria (20, 21). Studying the AR patterns and distribution of resistance markers such as ESBLs, Ints, and PAIs in UPEC isolates can provide valuable epidemiologic information and help general practitioners to prescribe effective medication against resistant UPECs (22, 23).
In this study, we have investigated patterns of resistance marker distribution and drug resistance in 50 E. coli strains isolated from 71 patients with UTIs.
The isolation rate of 70.4% UPEC among catheterized ICU patients in this study, while apparently high, is consistent with the established role of UPEC as the predominant pathogen in catheter-associated urinary tract infections (CAUTI), accounting for approximately 65-75% of complicated UTIs. The high prevalence observed may be attributed to the specific patient population (ICU setting with indwelling catheters), where the duration of catheterization and severity of underlying conditions are well-documented risk factors for infection. Previous studies have reported CAUTI prevalence rates ranging from 2.33% to 73.75%, reflecting the heterogeneity of ICU populations, infection control practices, and diagnostic criteria across different healthcare settings.
An additional limitation of this study is the lack of comprehensive clinical data regarding patients' comorbidities, including diabetes mellitus, chronic kidney disease, immunosuppressive conditions, and corticosteroid use. These factors have been identified as significant risk factors for both the development of catheter-associated urinary tract infections and the acquisition of multidrug-resistant organisms. The presence of such comorbidities could have influenced the resistance profiles observed in our UPEC isolates, as patients with underlying diseases often have longer hospital stays, more frequent antibiotic exposure, and higher rates of invasive device utilization. Future studies should incorporate detailed clinical data to enable stratified analyses of resistance patterns according to comorbidity status. Miri et al. studied E. coli pathotypes among clinical isolates from Iran (Figure 3) and reported 10.58% UPEC isolates (24). However, here we found an overall prevalence of 21.3% UPEC in the cases, which may imply the growing rate of UPEC distribution. The majority of UPEC sources (64%) in our study were female participants, and the predominant female gender with UTI. 63.6% of the UTI patients (25) (Figure 3) and 81.6% of them from Iran were females (26). The proportion in central Iran (Figure 3) was 78% females and 22% males (27). Consistent with our results, Alkhudhairy et al. recently reported the highest resistance rate to AMP in UPECs isolated from UTI patients in Iran (Figure 3). They also found the highest susceptibility rate for IMP. The rate of MDRs among our studied isolates was 62% (Figure 1D), which is lower than the 80.8% MDR rate they
identified (28). Also, a study from Babol in the north of Iran (Figure 3) showed that in UPEC from 57 urine samples, IMP and CIP were the most sensitive antibiotics at 87.7% and 78.9% rates respectively (29).
Although we also found IMP to be the most sensitive antibiotic in the current study, its frequency was slightly higher than the reported rate from Babol (Figure 3) and was detected at 94%. However, the frequency of sensitivity to CIP was much lower than that reported and was found to be 54%. Also, Issazadeh et al. reported from the north of Iran (Figure 3) that UPEC strains were highly resistant to COT 60% (68% in our study), TET 60% (same as our findings), and GEN 50.9% (38% for our isolates) while being susceptible to CIP 56.4% (54% in our study) (25). Moghaddam et al. reported that all ESBL producing UPEC isolates from the north of Iran (Figure 3) were resistant to TET (100%), CTX (87.5%), FEP (62.5%), IPM (62%) and CIP (37.5%) (30). Compared with the results of Moghaddam et al., the resistance rate to TET, CTX, and especially to IPM was lower in our studied bacteria. A study from Isfahan city, Iran (Figure 3) showed that 100% of UPEC isolates were susceptible to IPM (94% in the current study) and the rates of resistance to other antibiotics were as AMK (12.5%), GEN (14.84%), COT (25%), FEP (32%), CIP (55.46%), AMP (69.53%), and CTX (100%) (31). However, the prevalence of AR of E. coli varies from region to region in Iran (20). Co-resistance is the result of the accumulation of resistance markers to different classes of antibiotics, which happens through mutation or acquisition of novel resistance genes by horizontal transfer (32).
Considering antibiotic classes, the highest resistance was seen against CWSIs, and the highest susceptibility was found for DSIs (Figure1C). Therefore, DSIs such as ciprofloxacin and levofloxacin may still have a better antibiotic effect against UPECs. Surprisingly, Figure 1E showed that these two antibiotics represent the highest co-resistance pattern with other antibiotics. This means that, with a high likelihood, bacteria resistant to these DSIs were also resistant to many other types of antibiotics. Bourély et al. introduced co-resistance to amoxicillin and TET as an Indicator of MDR in E. coli isolated from animals (33).
Production of CTXM b-lactamases is a consequence of plasmid acquisition of the b-lactamases genes from other species. Due to the activities of these genes, some nosocomial and community-acquired infections caused by Gram-negative bacteria can now be treated with only a limited number of antibiotics (34-36). Also, it has been confirmed that the presence of Ints, especially Int1, is associated with the MDR phenotype in E. coli isolates (37-38). Furthermore, PAIs carry virulence genes and resistance markers and contain mobile genetic elements responsible for the development of UPECs (12-13).
In the central region of Iran, Isfahan (Figure 3), Gholipour et al. found the TEM and SHV genes in 12.14% and 7.47% of UPEC strains, respectively (27). Out of 92 UTI isolates from Hamadan, Iran (Figure 3), Hemati et al. reported 29.3%, and 17.4% of them possessed TEM and SHV markers, respectively (39).
However, we found that 42% of isolated UPECs from Zanjan (an adjacent province to Hamadan) contained SHV, and 46% harbored the TEM marker (Figure 3). These prevalence rates of TEM and SHV markers in the current study were remarkably higher than those reported from Isfahan (31) and Hamadan (Figure 3) (39). Alkhudhairy et al. identified IntI1, intI2, and Int3 in 61.6%, 6.6% and 0% of the UPECs isolated from UTI patients in the southwest of Iran (Figure 3), respectively (28). Likewise, we found these markers in 66%, 10%, and 0% of the isolates as well. Also, Moghaddam et al. found Int1 in 97% of UPEC in the north of Iran (Figure 3) (30). These data show that among Ints, Int1 is a more prevalent resistance marker in UPECs in different regions of the country. Here we showed that among resistant isolates to DNA synthesis inhibitors, folic acid synthesis inhibitors (Cotrimoxazole), and protein synthesis inhibitors, the frequency of Ints class was significantly higher in comparison to non-resistant bacteria to these antibiotics. As reported from UTI patients of southwest Iran, the presence of integrons was significantly associated with resistance to AMP and CIP antibiotics (28). In this study, most UPEC sources were female participants, and most isolates were resistant to antibiotics. Although the highest resistance was seen against cell wall synthesis inhibitors, no significant resistance was observed to IMP and AMP, which belong to this class. The highest susceptibility rate was found for DSIs, and therefore, agents such as ciprofloxacin and levofloxacin may still have a better antibiotic effect against UPECs. While our study provides valuable insights into the genetic diversity and resistance patterns of UPEC isolates in the Zanjan region, several limitations should be acknowledged. First, the sample size (n=50) limits the statistical power of subgroup analyses, particularly when comparing MDR versus non-MDR, XDR versus non-XDR, and resistance marker associations. Consequently, some associations that did not reach statistical significance in our analysis might become significant in larger cohorts. Second, the cross-sectional design of this study does not allow for assessment of temporal changes in resistance patterns or clonal transmission dynamics. Third, the study was conducted in a single geographical region (Zanjan province), which may limit the generalizability of our findings to other parts of Iran or other countries with different antibiotic prescription policies and epidemiological contexts. Future multi-center studies with larger sample sizes and longitudinal designs are warranted to validate these findings and to monitor the ongoing evolution of resistance determinants in UPEC populations.
Figure 3. Geographical regions of discussed studies. The figure depicts markers and resistance distribution reported from the different areas of the country.
5. Conclusion
This study identified a UPEC prevalence of 70.4%, accompanied by concerning MDR (62%) and XDR (22%) rates. The most effective antibiotics were imipenem and amikacin. The marked presence of ESBLs (78%), integrons (76%), and PAIs (96%), along with a strong integron-MDR correlation, suggests that horizontal gene transfer significantly contributes to resistance dissemination. Furthermore, the existence of 38 PFGE types reveals considerable genetic diversity. These data highlight the pressing need for continuous resistance monitoring, rational antimicrobial use, and geographically tailored treatment guidelines to mitigate the growing threat of antimicrobial resistance in UTIs.
This study identified a UPEC prevalence of 70.4%, accompanied by concerning MDR (62%) and XDR (22%) rates. The most effective antibiotics were imipenem and amikacin. The marked presence of ESBLs (78%), integrons (76%), and PAIs (96%), along with a strong integron-MDR correlation, suggests that horizontal gene transfer significantly contributes to resistance dissemination. Furthermore, the existence of 38 PFGE types reveals considerable genetic diversity. These data highlight the pressing need for continuous resistance monitoring, rational antimicrobial use, and geographically tailored treatment guidelines to mitigate the growing threat of antimicrobial resistance in UTIs.
6. Declarations
6.1 Acknowledgments
The authors are grateful to lab assistants of the Microbiology Departments of Zanjan and Hamedan Universities of Medical Sciences for their friendly help.
6.2 Ethical Considerations
This study was conducted in accordance with the ethical standards outlined in the Declaration of Helsinki and approved by the relevant research ethics committee. The research utilized the ethics code 90/90-392-01 (13830507972006). Additionally, this study was part of a PhD thesis approved by Islamic Azad University of Zanjan (IAU Zanjan).
6.3 Authors' Contributions
All authors have made substantial contributions to all of the following: RSh and ESH the conception and design of the study, HZ and LSh acquisition of data, analysis, and interpretation of data, (2) HZ and ESH drafting the article, revising it and RSh final approval of the version to be submitted.
6.4 Conflict of Interest
The authors declare that they have no competing interests.
6.5 Fund or Financial Support
This study was a self-funded (Elahe Sadat Hajimiri) research project (As PhD Thesis 13830507972006).
6.6 Using Artificial Intelligence Tools (AI Tools)
The authors did not use artificial intelligence tools in the preparation of this manuscript
6.1 Acknowledgments
The authors are grateful to lab assistants of the Microbiology Departments of Zanjan and Hamedan Universities of Medical Sciences for their friendly help.
6.2 Ethical Considerations
This study was conducted in accordance with the ethical standards outlined in the Declaration of Helsinki and approved by the relevant research ethics committee. The research utilized the ethics code 90/90-392-01 (13830507972006). Additionally, this study was part of a PhD thesis approved by Islamic Azad University of Zanjan (IAU Zanjan).
6.3 Authors' Contributions
All authors have made substantial contributions to all of the following: RSh and ESH the conception and design of the study, HZ and LSh acquisition of data, analysis, and interpretation of data, (2) HZ and ESH drafting the article, revising it and RSh final approval of the version to be submitted.
6.4 Conflict of Interest
The authors declare that they have no competing interests.
6.5 Fund or Financial Support
This study was a self-funded (Elahe Sadat Hajimiri) research project (As PhD Thesis 13830507972006).
6.6 Using Artificial Intelligence Tools (AI Tools)
The authors did not use artificial intelligence tools in the preparation of this manuscript
Type of Study: Original Research Article |
Subject:
Epidemiologic Studies
Received: 2026/06/13 | Accepted: 2026/08/16 | Published: 2026/08/4
Received: 2026/06/13 | Accepted: 2026/08/16 | Published: 2026/08/4
References
1. Bal M, Pati S, Biswas S, Suar M, Ranjit M, Rana R. Escherichia coli associated urinary tract infection: Epidemiology and possible strategies for control. One Health Bullet. 2025;5(2):51-7. [DOI:10.4103/ohbl.ohbl_56_24]
2. Bhuiya S, Kaushik S, Logheeswaran J, Karthika P, Prathiviraj R, Selvin J, et al. Emergence of recurrent urinary tract infection: Dissecting the mechanism of antimicrobial resistance, host-pathogen interaction, and hormonal imbalance. Microb Pathogen. 2025;206:107698. [DOI:10.1016/j.micpath.2025.107698] [PMID]
3. Larkin C, Valappil SP, Palanisamy N. Global prevalence of nitrofurantoin-resistant uropathogenic Escherichia coli (UPEC) in humans: a systematic review and meta-analysis.J Antimicrob Chemother. 2025;80(10):2609-21. [DOI:10.1093/jac/dkaf305] [PMID] [PMCID]
4. Dziuba A, Białek J, Wawszczak-Kasza M, Janczura J, Dulębska J. The role of intracellular bacterial communities of uropathogenic Escherichia Coli in chronic urinary tract infection and new therapeutic ideas. Curr Clin Microbiol Rep. 2025;12(1):16. [DOI:10.1007/s40588-025-00253-0]
5. Sohrabi R, Zeighami H. Determination of phylogenetic groups and antibiotic resistance in uropathogenic and commensal Escherichia Coli isolated from patients in Zanjan city. J Adv Med Biomed Res. 2016;24(107):107.
6. Tamas V, Ulloa ER, Kumaraswamy M, Dahesh S, Zurich R, Nizet V, et al. Extended-spectrum β-lactamase-producing Escherichia coli and pediatric UTIs: A review of the literature and selected experimental observations. Antibiotics (Basel, Switzerland). 2025;14(12). [DOI:10.3390/antibiotics14121284] [PMID] [PMCID]
7. Zhuo C, Xu Y, Yu Y. Expert consensus on clinical management strategies for infections caused by extended-spectrum β-lactamase-producing Enterobacterales(2025). Med J Peking :union: Med College Hospital. 2025;16(5):1102-19.
8. Park J, Joo EY, Lee J-E, Kim SJ. Clinical impacts and management of urinary tract infections caused by extended-spectrum beta-lactamase-producing Enterobacteriaceae in children: a narrative review. Child Kidney Dis. 2025;29(3):104-11. [DOI:10.3339/ckd.25.028] [PMID] [PMCID]
9. Halaji M, Feizi A, Mirzaei A, Sedigh Ebrahim-Saraie H, Fayyazi A, Ashraf A, et al. The global prevalence of class 1 integron and associated antibiotic resistance in Escherichia coli from patients with urinary tract infections. A systematic review and meta-analysis. Microb Drug Resist (Larchmont, NY). 2020;26(10):1208-18. [DOI:10.1089/mdr.2019.0467] [PMID]
10. Shao F, Li D, Wang J, Tuo Z, Wang Z, Wei W, et al. Beta-lactamase-mediated antibiotic resistance in urinary tract infections: Mechanisms and therapeutic strategies. Urogenit Tract Infect. 2025;20(2):67-81. [DOI:10.14777/uti.2550012006]
11. Keramati N, Zeighami H, Haghi F. Frequency of class I and II integrons in metalobetalactamase producing clinical isolates of Pseudomonas Aeruginosa. J Adv Med Biomed Res. 2014;22(94):111.
12. Varghese A, Saleena UV, Bhat G, Ke V, Am C. Comparison of genetic factors of Escherichia coli in patients with urosepsis and urinary tract infections. A systematic review. Rev Res Med Microbiol. 2023;34(2). [DOI:10.1097/MRM.0000000000000331]
13. Etefia EU, Ben SA. Virulence markers, phylogenetic evolution, and molecular techniques of uropathogenic Escherichia coli. J Natur Sci Med. 2020;3(1). [DOI:10.4103/JNSM.JNSM_31_19]
14. Azimzadeh N, Derakhshandeh A, Motamedifar M, Naziri Z. Clonal relatedness, phylotyping and antimicrobial susceptibility of extended- spectrum-beta-lactamase producing uropathogenic Escherichia coli isolates from outpatients and inpatients. Infect Disorder Drug Target. 2020;20(5):659-66. [DOI:10.2174/1871526519666190715152118] [PMID]
15. Kao CY, Zhang YZ, Yang DC, Chen PK, Teng CH, Lin WH, et al. Characterization of host and escherichia coli strains causing recurrent urinary tract infections based on molecular typing. BMC Microbiol. 2023;23(1):90. [DOI:10.1186/s12866-023-02820-1] [PMID] [PMCID]
16. Saladin M, Cao VT, Lambert T, Donay JL, Herrmann JL, Ould-Hocine Z, et al. Diversity of CTX-M beta-lactamases and their promoter regions from Enterobacteriaceae isolated in three Parisian hospitals. FEMS Microbiol Lett. 2002;209(2):161-8. [DOI:10.1111/j.1574-6968.2002.tb11126.x] [PMID]
17. Arlet G, Rouveau M, Philippon A. Substitution of alanine for aspartate at position 179 in the SHV-6 extended-spectrum beta-lactamase. FEMS Microbiol Lett. 1997;152(1):163-7. [DOI:10.1111/j.1574-6968.1997.tb10423.x] [PMID]
18. Machado E, Cantón R, Baquero F, Galán JC, Rollán A, Peixe L, et al. Integron content of extended-spectrum-beta-lactamase-producing Escherichia coli strains over 12 years in a single hospital in Madrid, Spain. Antimicrob Agent Chemother. 2005;49(5):1823-9. [DOI:10.1128/AAC.49.5.1823-1829.2005] [PMID] [PMCID]
19. Moradpoor Shamami A, Anvari M,Pourmoshtagh H,Shafighi S, Seddigh Ebrahim-Saraie H. Serogroup and pathogenicity island marker distributions among uropathogenic Escherichia coli isolates in Rasht, Iran. Jundishapur J Microbiol. 2023;16(1). [DOI:10.5812/jjm-132754]
20. Smelov V NK, Bjerklund Johansen TE. Improved classification of urinary tract infection: Future considerations. Europ Urol Suppl. 2016;15:10. [DOI:10.1016/j.eursup.2016.04.002]
21. Tandogdu Z, Cek M, Wagenlehner F, Naber K, Tenke P, van Ostrum E, et al. Resistance patterns of nosocomial urinary tract infections in urology departments: 8-year results of the global prevalence of infections in urology study. W J Urol. 2014;32(3):791-801. [DOI:10.1007/s00345-013-1154-8] [PMID]
22. Sun DH, Lv DF, Mi ZH, Hu LQ, Huang Y, Gao X, et al. Investigation of antibiotic resistance determinants and virulence factors of uropathogenic Escherichia coli. J Antibiotic. 2020;73(5):314-9. [DOI:10.1038/s41429-020-0284-7] [PMID]
23. Sarowska J, Futoma-Koloch B, Jama-Kmiecik A, Frej-Madrzak M, Ksiazczyk M, Bugla-Ploskonska G, et al. Virulence factors, prevalence and potential transmission of extraintestinal pathogenic Escherichia coli isolated from different sources: recent reports. Gut Pathogen. 2019;11:10. [DOI:10.1186/s13099-019-0290-0] [PMID]
24. Miri ST, Dashti A, Mostaan S, Kazemi F, Bouzari S. Identification of different Escherichia coli pathotypes in north and north-west provinces of Iran. Iran J Microbiol. 2017;9(1).
25. Issazadeh K NS, Khoshkholgh-Pahlaviani MRM. Drug resistance and serotyping of uropathogenic Escherichia coli among patients with urinary tract infection in Rasht, Iran. Zahedan J Res Med Sci. 2015;27(17):6. [DOI:10.17795/zjrms989]
26. Mohajeri P, Darfarin G, Farahani A. Genotyping of ESBL producing uropathogenic Escherichia coli in west of Iran. Int J Microbiol. 2014;2014(1):276941. [DOI:10.1155/2014/276941] [PMID] [PMCID]
27. Neamati F, Firoozeh F, Saffari M, Zibaei M. Virulence genes and antimicrobial resistance pattern in uropathogenic Escherichia coli isolated from hospitalized patients in Kashan, Iran. Jundishapur J Microbiol. 2015;8(2):e17514. [DOI:10.5812/jjm.17514] [PMID] [PMCID]
28. Alkhudhairy M, Saki M, Seyed-Mohammadi S, Jomehzadeh N, Khoshnood S, Moradzadeh M, et al. Integron frequency of Escherichia coli strains from patients with urinary tract infection in Southwest of Iran. J Acute Dis. 2019;8:113-7. [DOI:10.4103/2221-6189.259110]
29. Ferdosi-Shahandashti E, Javanian M, Moradian-Kouchaksaraei M, Yeganeh B, Bijani A, Motevaseli E, et al. Resistance patterns of Escherichia coli causing urinary tract infection. Caspian J Int Med. 2015;6(3):148-51.
30. Mehdipour Moghaddam MJ, Mirbagheri AA, Salehi Z, Habibzade SM. Prevalence of class 1 integrons and extended spectrum beta lactamases among multi-drug resistant Escherichia coli isolates from North of Iran. Iran Biomed J. 2015;19(4):233-9.
31. Gholipour A, Soleimani N, Shokri D, Mobasherizadeh S, Kardi M, Baradaran A. Phenotypic and molecular characterization of extended-spectrum β-lactamase produced by Escherichia coli, and Klebsiella pneumoniae isolates in an educational hospital. Jundishapur J Microbiol. 2014;7(10):e11758. [DOI:10.5812/jjm.11758] [PMID] [PMCID]
32. Tacão M, Moura A, Correia A, Henriques I. Co-resistance to different classes of antibiotics among ESBL-producers from aquatic systems. Water Res. 2014;48:100-7. [DOI:10.1016/j.watres.2013.09.021] [PMID]
33. Bourély C, Cazeau G, Jarrige N, Jouy E, Haenni M, Lupo A, et al. Co-resistance to amoxicillin and tetracycline as an indicator of multidrug resistance in Escherichia coli isolates from animals. Front Microbiol. 2019;10:2288. [DOI:10.3389/fmicb.2019.02288] [PMID] [PMCID]
34. Bush K. Bench-to-bedside review: The role of beta-lactamases in antibiotic-resistant Gram-negative infections. Crit care (London, England). 2010;14(3):224. [DOI:10.1186/cc8892] [PMID] [PMCID]
35. Bush K. Past and present perspectives on β-lactamases. Antimicrob Agent Chemother. 2018;62(10). [DOI:10.1128/AAC.01076-18] [PMID] [PMCID]
36. Yekani M, Memar MY, Baghi HB, Sefidan FY, Alizadeh N, Ghotaslou R. Association of integrons with multidrug-resistant isolates among phylogenic groups of uropathogenic Escherichia Coli. Microbiol Res [Internet]. 2018; 9(1):[7484 p.]. [DOI:10.4081/mr.2018.7484]
37. Rawat D, Nair D. Extended-spectrum β-lactamases in gram negative bacteria. J Global Infect Dis. 2010;2(3):263-74. [DOI:10.4103/0974-777X.68531] [PMID] [PMCID]
38. Mirza S, Jadhav S, Misra RN, Das NK. Coexistence of β-lactamases in community-acquired infections in a tertiary care hospital in India. Int J Microbiol. 2019;2019:7019578. [DOI:10.1155/2019/7019578] [PMID] [PMCID]
39. Hemati Z, Ghanbarpour R, Alizade H. The distribution of beta lactamase genes in Escherichia coli phylotypes isolated from diarrhea and UTI cases in northwest Iran. Adv Clin Experiment Med. 2014;23(4):523-9. [DOI:10.17219/acem/37217] [PMID]
Send email to the article author
| Rights and permissions | |
 |
This work is licensed under a Creative Commons Attribution-NonCommercial 4.0 International License. |
Copyright Policy
Journal of Advances in Medical and Biomedical Research by Zanjan University of Medical Sciences is licensed under CC BY-NC 4.0