


BibTeX | RIS | EndNote | Medlars | ProCite | Reference Manager | RefWorks
Send citation to:
URL: http://journal.zums.ac.ir/article-1-6837-en.html


 , Saeed Oraee-Yazdani2 , Mohsen Vahedi1 , Marzieh Peyravi Dehsorkhi2 , Samaneh Hosseinzadeh *3
2- Shohada-E-Tajrish Neurosurgical Center of Excellence, Functional Neurosurgery Research Center, Shohada-E-Tajrish Hospital, Shahid Beheshti University of Medical Sciences, Tehran, Iran
3- Dept. of Biostatistics, University of Social Welfare and Rehabilitation Sciences, Tehran, Iran ,
✅ Based on the results, the factors such as age, tachycardia, and some CT-scan findings (SAH, ICH, and SDH), as well as high coagulation profile (INR, PTT) and low GCS on admission, were important variables to the prognosis of TBI patients. During hospitalization, high values of BUN, PR, Cr, FBS, PT, and INR and low values of GCS, RR, and PH were associated with a worthwhile outcome. In addition, high changes in BUN, GCS, RR, PR, and BP during hospitalization should be considered a worthwhile prognosis.
Trauma is the second cause of death and the most crucial reason for hospitalization in Iran (1-3). Severe strokes lead to permanent neurological disorders (about 20%), coma (14%), and death (20-40%) among adults, resulting in decreasing life expectancy by about 3-11 years (4-6). In general, the prognosis of patients is essential due to the possibility of death or reduced ability, and both the family and the medical team prefer to predict the patient's outcome. The pathophysiology and outcome of TBI are complex due to an interaction between the primary and secondary injury responses. To establish the diagnosis of TBI, the primary clinical tool used in the emergency department is computed tomography (CT) (7). CT is the modality of choice as it quickly and accurately identifies both extra-axial hemorrhage (subarachnoid hemorrhage (SAH), Subdural hemorrhage (SDH), Extradural hematoma (EDH), and intra-axial hemorrhage. Magnetic resonance imaging (MRI) has better diagnostic sensitivity for certain types of injuries. Still, CT has been the mainstay of imaging acute TBI due to its speed, accessibility, and sensitivity to hemorrhage. Historically, it is invaluable for diagnosing, managing, and prognosis patients with TBI. Also, MRI is often not feasible to assess regularly in the acute phase (8).
On the other hand, a biomarker is generally defined as an indicator of the state observed by the patient. A biomarker can be measured accurately and reproducibly after TBI and could aid in diagnosing the injury, monitoring disease progression, and predict outcomes (7). The complex pathophysiology of TBI makes finding useful biomarkers challenging. Most biomarkers often lack the sensitivity and specificity required for daily clinical care. Therefore, studies are now investigating biomarker panels consisting of markers that cover possible active pathophysiological pathways in TBI (7). Studies aimed at evaluating different markers in predicting outcomes indicated that sodium (Na), creatinine (4), and blood coagulation factors could be used in predicting outcomes (9, 10).
Further, old age and increased leukocytosis are highly related to unfavorable outcomes (10-14). Liu (2021) reported that age, GCS, admission time, tachycardia, tracheostomy, and several platelets could be independent predictors of clinical prognosis in patients with severe TBI (15). Using a longitudinal study, Maguire indicated that an increase in sodium affects the mortality rate of the patients directly (16). Prognosis in TBI patients may not be accurate based on only one value of biomarker on admission or the first day of hospitalization because most patients are hospitalized for longer, and biomarkers are more changed during time while using more biomarkers during time can be utilized (17). Assessing the trend of blood markers in comatose patients can be important in predicting and facilitating treatment decision-making. Thus, the present study aimed to evaluate and compare different blood markers and CT-scan results during hospitalization for death and recovery as the outcomes of coma.
A longitudinal-retrospective, observational study seeks to examine the status of 133 patients with comatose due to head trauma from admission to death/exit coma in Shohada-E-Tajrish Hospital in Tehran during 2018-20. To this aim, 604 registered cases were enumerated entirely, the information of patients who met the inclusion criteria was collected, and the follow-up period lasted 15 days after hospitalization. Inclusion criteria included age 14 years and older, diagnosis of trauma-induced coma with a neurosurgeon, and GCS score equal to 8 or less on one day of hospitalization. Information was recorded anonymously and confidentially. The present study was approved by the Ethics Committee (University of Social Welfare and Rehabilitation Sciences, IR.USWR.REC.1399.190).
Clinical Information and Laboratory Examination
Variables such as age, gender, weight, height, BMI (BMI<25: normal), blood type, trauma mechanism, heart disease (MI) (yes, no), hypertension (yes, no), diabetes (yes, no), smoking (yes, no) were gathered on patients’ file at admission. This information was based on the Patient's self-report at admission. CT-scan findings were recorded by a neurologist who analyzed the patient's CT scan upon admission and recorded it in the patient’s file; this study only gathered them. Those were tachycardia (yes, no), contusion (yes, no), subdural hematoma (SDH) (yes, no), intracranial hemorrhage (yes, no), epidural hematoma (EDH) (yes, no), and subarachnoid hemorrhage (SAH) (yes, no). Unfortunately, there was not another CT scan during the patient’s hospitalization. Most of the vital signs were quantitative: systolic and diastolic blood pressure (BP), body temperature (BT), pulse rate (PR), and respiratory rate (RR) were measured every six hours and recorded from the patient's file. GCS score was also collected through the disease form every six hours. Blood biomarkers also were quantitative: Values of sodium (Na), blood nitrogen (BUN), creatinine, white blood cell count (WBC), international normalized ratio (INR), prothrombin time (PT), partial thromboplastin time (PTT), and blood pH range were recorded from clinical trials every 24 hours.
The outcome of patients, including non-survivor and survivors, was recorded after a coma.
Statistical Analysis
The admission patients’ demographic data and CT-scan were reported separately in two groups of non-survivor and survivor. Their relationship was assessed with an odds ratio and 95% confidence interval. There was missing data because the patients’ blood tests were not on time. Mostly, those data were replaced with data on near times (±1 hours) if there was; if no, the times were removed for the specific patient. To check the simultaneous relationship with death, the variables with a P-value less than 0.2 were identified in the univariate logistic regression model, entered in the multivariate model, and confirmed as a forwarding selection procedure. Profile graph was used to assess the trend of patients’ daily parameters. The patients' daily mean was calculated and plotted separately in two groups of non-survivor and survivor. The variance of the daily mean for each marker in the aforementioned groups was compared with Levene’s test. The trend of changes in the means in the two groups was compared and interpreted visually. The relationship between the values of blood tests and death was evaluated with generalized equating estimation (GEE) and the logit link function, which are utilized for longitudinal data measured over time when the response is considered binary. Analyzes were performed in R 3.6.3 (Deepack package) and Excel software.
We assessed 133 patients with comatose, of which 112 (84.21%) were male. The patients aged 14-97 years with a median of 47 years and a mean of 48.61 (SD=22.77). The maximum follow-up time was 363, and the median and mean were 87 and 106.37 hours, respectively. The death occurred for 78 patients (58.64%), and the mean GCS score during admission was 6.93 (SD=4.21). Table 1 shows descriptions of other specifications. The univariate logistic model showed that there is a significant relationship between age, tachycardia, SAH, SDH, and occurrence of death (p<0.05). SDH has the highest value of OR (OR=8.28) (Table 1). Results of multivariate logistic regression showed that there is a significant relationship between tachycardia (OR=60.1, P=0.003), ICH (OR=9.91, P<0.001), SDH (OR=39.3, P<0.001), SAH (OR=13.6, P<0.001) to death. In addition, the age variable in this model (OR=1.90, P=0.211) was not significant.
Table 1. Demographic and CT-Scan results on admission based on outcome of patients
| Variable | Levels | Dead | Alive | OR | 95% CI (OR) | ||
| n | % | n | % | ||||
| Gender | Male | 66 | 58.92 | 46 | 41.07 | 1.08 | 0.42-2.78 |
| female | 12 | 57.14 | 9 | 42.85 | - | - | |
| Age* | 14-59 | 37 | 48.05 | 40 | 51.94 | - | - |
| >=60 | 41 | 73.21 | 15 | 26.78 | 2.96 | 1.41-6.20 | |
| BMI | Normal | 43 | 59.72 | 29 | 40.27 | - | - |
| obese | 35 | 57.37 | 26 | 42.62 | 0.91 | 0.45-1.81 | |
| Blood type | A | 22 | 56.41 | 17 | 43.58 | - | - |
| B | 17 | 56.66 | 13 | 43.33 | 1.01 | 0.39-2.64 | |
| AB | 7 | 77.77 | 2 | 22.22 | 2.71 | 0.49-14.72 | |
| O | 32 | 58.18 | 23 | 41.81 | 1.08 | 0.47-2.46 | |
| Mechanism | Accident | 35 | 57.37 | 26 | 42.62 | 1.08 | 0.26-4.41 |
| Felt | 38 | 60.31 | 25 | 39.68 | 1.22 | 0.30-4.97 | |
| other | 5 | 55.55 | 4 | 44.44 | - | - | |
| MI* | No | 52 | 53.06 | 46 | 46.93 | - | - |
| Yes | 26 | 74.28 | 9 | 25.71 | 2.56 | 1.09-6.01 | |
| Hypertension | No | 49 | 53.84 | 42 | 46.15 | - | - |
| Yes | 29 | 69.04 | 13 | 30.95 | 1.91 | 0.88-4.14 | |
| Diabetes | No | 62 | 55.85 | 49 | 44.14 | - | - |
| Yes | 16 | 72.72 | 6 | 27.27 | 2.11 | 0.77-5.79 | |
| Smoking | No | 62 | 60.19 | 41 | 39.80 | - | - |
| Yes | 16 | 53.33 | 14 | 46.66 | 0.76 | 0.33-1.71 | |
| Tachycardia* | No | 61 | 53.98 | 52 | 46.01 | - | - |
| Yes | 17 | 85 | 3 | 15 | 4.83 | 1.34-17.41 | |
| Contusion | No | 41 | 55.40 | 33 | 44.59 | - | - |
| Yes | 37 | 62.71 | 22 | 37.28 | 1.35 | 0.67-2.72 | |
| ICH | No | 43 | 53.08 | 38 | 46.91 | - | - |
| Yes | 35 | 67.30 | 17 | 32.69 | 1.82 | 0.88-3.76 | |
| SDH* | No | 19 | 32.20 | 40 | 67.79 | - | - |
| Yes | 59 | 79.72 | 15 | 20.27 | 8.28 | 3.77-18.99 | |
| EDH | No | 44 | 57.14 | 32 | 42.85 | - | - |
| Yes | 34 | 60.71 | 23 | 39.28 | 1.16 | 0.58-2.34 | |
| SAH* | No | 37 | 45.12 | 45 | 54.87 | - | - |
| Yes | 41 | 80.39 | 10 | 19.60 | 4.99 | 2.20-11.29 | |
- BMI: body mass index, MI: myocardial infarction, ICH: intracranial hemorrhage, SDH: subdural hematoma, EDH: epidural hematoma, SAH: subarachnoid hemorrhage, * is significant on 0.05.
The mean of vital signs and laboratory at the beginning of hospitalization between the two groups was compared with the t-test. A significant difference was reported in the mean heart rate, systolic and diastolic blood pressure, Cr level, PTT, PT, and INR in non-survivor and survivor groups. The mean is higher in the non-survivor group in all variables, except systolic and diastolic blood pressure, in which the mean value is lower in the non-survivor group (Table 2-a).
Table 2. a) Comparison means of vital signals and blood tests on admission based on outcome of patients. b) Comparison variance of daily means of vital signals and blood tests based on outcome of patients
| Variables | a) On admission, t-test (mean) | b) min, max, SD of Daily means, Leven’s test (variance of daily means) |
||||||||||
| Dead | Alive | P-value | Dead | Alive | P-value | |||||||
| m | SD | m | SD | min | max | SD | min | max | SD | |||
| Na | 137.18 | 4.97 | 138.01 | 4.85 | 0.284 | 124 | 147.15 | 5.64 | 135.38 | 143.52 | 2.72 | 0.105 |
| BUN | 20.53 | 12.31 | 16.76 | 7.80 | 0.630 | 12 | 16.85 | 9.57 | 12 | 49.25 | 1.37 | <0.001* |
| Cr | 1.25 | 0.67 | 1.11 | 0.33 | 0.027 | 0.73 | 1.81 | 0.24 | 0.70 | 1.10 | 0.11 | 0.189 |
| FBS | 159.33 | 73.35 | 106.00 | 111.72 | 0.305 | 90 | 140 | 15.93 | 140 | 191 | 18.94 | 0.823 |
| WBC | 14.62 | 5.90 | 15.12 | 5.52 | 0.600 | 10.41 | 17.00 | 2.35 | 8.50 | 16.90 | 2.49 | 0.933 |
| PTT | 36.81 | 10.68 | 33.33 | 2.93 | <0.001* | 35 | 42.4 | 2.20 | 30 | 35 | 1.65 | 0.351 |
| PT | 15.02 | 3.27 | 13.64 | 0.98 | <0.001* | 13 | 16.78 | 0.82 | 13 | 14.81 | 0.56 | 0.448 |
| INR | 1.27 | 0.47 | 1.09 | 0.13 | <0.001* | 1 | 1.51 | 0.11 | 1 | 1.18 | 0.06 | 0.159 |
| PH | 7.32 | 0.12 | 7.31 | 0.10 | 0.960 | 7.24 | 7.40 | 0.03 | 7.31 | 7.48 | 0.03 | 0.994 |
| GCS | 4.99 | 2.61 | 6.98 | 2.40 | <0.001* | 2 | 7 | 1.18 | 6.63 | 15 | 2.10 | <0.001* |
| PR | 88.71 | 21.08 | 82.71 | 12.19 | <0.001* | 82.88 | 113 | 7.08 | 76.16 | 89.93 | 3.04 | <0.001* |
| RR | 16.99 | 3.96 | 17.60 | 3.71 | 0.285 | 11 | 19.35 | 1.81 | 17.33 | 20.50 | 0.55 | <0.001* |
| Systolic BP | 116.64 | 27.02 | 118.29 | 16.97 | 0.003* | 91 | 148.22 | 9.42 | 118.14 | 136.17 | 3.55 | <0.001* |
| Diastolic BP | 70.67 | 17.23 | 74.85 | 11.64 | 0.028* | 50 | 89.89 | 5.92 | 73.13 | 85.20 | 2.28 | <0.001* |
| BT | 36.83 | 0.68 | 36.79 | 0.51 | 0.434 | 36.39 | 37.80 | 0.22 | 36.63 | 37.25 | 0.11 | 0.002* |
- Na: sodium, BUN: blood urea nitrogen, Cr: creatinine, FBS: fasting blood sugar, WBC: white blood cell count, PTT: partial thromboplastin time, PT: prothrombin time, INR: international normalized ratio, PH: potential of hydrogen, GCS: Glasgow coma scale, PR: Pulse Rate, RR: Respiratory Rate, BP: blood pressure, TB: body temperature, *: is significant
Daily means of blood markers and vital signs are represented in profile diagrams separately in non-survivor and survivor groups (Fig 1-4). The Na values of the two groups become different from the second day (Fig. 1-a). BUN graph displays clearly that the two groups differ significantly, except for the beginning and the end of the study (Fig. 1-b). Cr clearly indicates a higher mean in the non-survivor group than in the survivor group (Fig. 1-c). FBS fluctuates sharply in both groups, and no stability is observed in either group, so its trend is ascending and then descending in the survivor group. The mean is always higher in the non-survivor group (Fig. 1-d). WBC is almost the same in both groups, although it is always higher in the non-survivor group.
Interestingly, the trend of WBC is first downward and then upward (Fig. 1-e). PTT seems almost the same in both groups in the first five days, while its value increases in the non-survivor group after the fifth day (Fig. 2-a). The mean of PT is almost parallel and similar in the two patient groups until the fifth day. Then, the mean in the non-survivor group increases with more changes (Fig. 2-b). The mean of INR in the non-survivor group is always more than that of the survivor group and has more fluctuations (Fig.2-c). PH is almost parallel during the hospitalization in the two groups and is always lower in the non-survivor group (Fig. 2-d). GCS is always lower in the non-survivor group and has fewer changes (Fig. 2-e). In the non-survivor group, PR initially has a steady trend with a slightly negative slope until the sixth day and then increases. However, in the survivor group, the trend decreases after the sixth day. PR is always more in the non-survivor group (Fig. 3-a). In the survivor group, RR has a steady trend with a slight upward at the end of the follow-up, while in the non-survivor group, it has a steady trend until the fourth day with an increasing slope (Fig. 3-b). Systolic blood pressure is almost equal until the third day in both groups. However, it increases in non-survivor patients. The survivor group has almost a fixed line with a slight slope (Fig. 3c). Diastolic blood pressure is almost equal in both groups until the twelfth day. Then, it decreases sharply in the non-survivor group (Fig. 3-d). BT has the same trend in two groups at the beginning of hospitalization. However, it decreases since the fifth day in the non-survivor group and then increases. BT is lower in the non-survivor group (Fig. 3-e). Based on the graphs, the dispersion of daily means for blood factors seems to differ between the two groups. Therefore, the variance of daily means in the two groups was compared with Levene’s test. Based on the results, the variance of BUN, GCS, BT, PR, RR, and systolic and diastolic blood pressure in the non-survivor group is significantly higher (Table 2b). The marginal logistic GEE model was fitted for each longitudinal blood marker univariately. In the mentioned model, the univariate relationship of all variables with the outcome is significant, except BT and WBC.
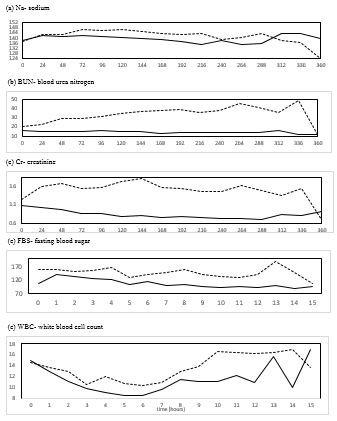
Figure 1. The trend of daily means of Na, BUN, Cr, FBS, and WBC. Zero time is the admission time of each patient. Solid line (-) shows alive, and dot line (…) shows dead patients.
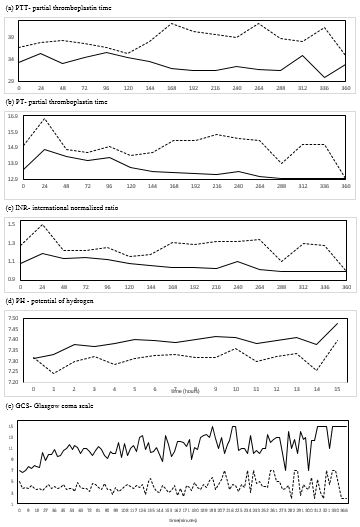
Figure 2. Trend of daily means of PTT, PT, INR, PH , and GCS. Zero time is admission time of each patient. Solid line (-) shows alive and dot line (…) shows dead patients.
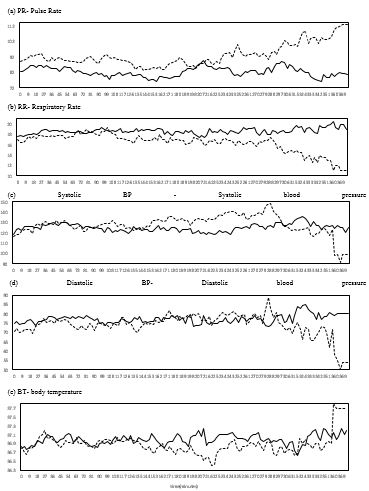
Figure 3. Trend of daily means of PR, RR, systolic, diastolic, and BT. Zero time is the admission time of each patient. Solid line (-) shows alive, and dot line (…) shows dead patients.
Discussion
Based on the results, old age, heart disease, tachycardia, SAH, and SDH on admission were among the risk factors for death, which were significant in the univariate model. However, in the multivariate model, age and heart disease were not significant, while tachycardia, SDH, IDH, and SAH had a significant relationship. On admission, a significant difference was observed in mean Cr, PTT, PT, INR, GCS, PR, and systolic and diastolic blood pressure between the two groups. Investigating the trend of changes and changes in blood markers and vital signs in patients during hospitalization through a graph and comparing the variance in the two groups of non-survivor and survivor indicated that the variance of GCS, PR, RR, systolic and diastolic blood pressure, BT, and BUN was higher in the non-survivor group. Lines of blood markers such as GCS, Cr, BUN, PTT, PT, INR, FBS, and PH don’t overlap and are separate in the two groups, showing that these markers have good prognosis outcomes. Due to the small number of longitudinal studies in this field, first, their results are reported and compared with the present study, then results of cross-sectional studies are reported.
Using a prospective longitudinal study, Maggiore checked the effect of factors on death time by a time-dependent Cox model. Laboratory values were measured daily. By adjusting the effects of routine variables on admission, only hypernatremia had a significant relationship with decreasing coma duration and increasing death (16). In the present study, no distinction was clearly observed in the Na graph; the dispersion and mean on admission were not significantly different in the two groups. However, a significant relationship was observed in the GEE model. The mismatch may be because Maggiore’s study investigated the relationship between sodium and survival time. At the same time, the two groups were compared in the present study. In other words, the type of model and response used in the two studies are different. Harrois recorded blood sodium for the first 7 days using a multicenter longitudinal study in Europe and Australia. They assessed the relationship between patients' daily sodium variance with death risk by the Cox model. Sodium dispersion was negatively correlated with the time of death (18). In the present study, sodium distribution in the non-survivor group was 5.64, more than in the survivor group. (2.72). However, the difference between the two groups was not significant. The difference in data is considered the reason for the inconsistent results in these two studies. In the present study, the variance of the daily means in the two groups was compared. In contrast, the relationship between the variance of all sodium values and the survival time was evaluated in the Harrois’ study. Ssebakumba (2020) performed a prospective observational cohort study of 109 adults with a clinical-radiological diagnosis of ASDH and/or AEDH based on head and brain CT imaging confirmed extra-axial hematomas. Admitted patients were followed-up 30 days after admission. Dependent variables were discharged, died, or still admitted. Factors associated with a favorable outcome were admission with systolic BP>90, oxygen saturation>90%, and diagnosis of AEDH. The study revealed that post-resuscitation GCS, systolic BP, oxygen circulation, and diagnosis of AEDH at admission are the most important determinants of outcome for patients with extra-axial intracranial hematomas (19).
Studies examining the factors related to outcomes in patients with head trauma are often cross-sectional and retrospective. Accordingly, vital signs and laboratory results are usually collected on admission (1, 2, 15, 20-23) or within the first 24 or 48 hours after admission, and only one value is recorded (3, 24-28). In some studies, in-hospital death (1-3, 20, 22, 26, 28-30) and in some others, unfavorable outcomes six months after discharge (10, 15, 21, 23-25, 27) are regarded as the main outcome. The content is separately presented based on the factors related to the outcome.
BUN, Cr, and NA
In most cases, the values of factors are divided into low and high. However, the relationship's significance is not considered stable in different studies. In some studies, NA is related to death or unfavorable outcomes (3, 21, 29); in others, the relationship is not considered significant (24, 26). The result of the present study is consistent with those of non-significance ones. No significant difference for Na was reported in the graph, neither on admission nor in the daily mean variance. In the case of BUN and Cr, Fatih Gul failed to find a significant relationship between Cr and death (20). Liu reported no significant relationship between BUN and Cr with unfavorable outcomes (15). However, in some studies, a significant relationship was observed between high values mentioned above and the risk of hospital death or unfavorable outcome (24, 26, 29). In the present study, BUN and Cr in the non-survivor group are higher than in the other group. The dispersion of BUN and Cr and the mean of Cr on admission significantly differed between the two groups. Thus, the changes and fluctuations of BUN in patients during hospitalization and the value of Cr during admission should be considered.
Blood coagulation
This phenomenon is measured by at least one of the factors, such as the number of blood platelets, PTT, PT, and INR. Van Beek reported high PT related to more unfavorable outcomes (21). Dolmans indicated a significant relationship between low blood platelets and high INR and PT with death (26). Further, Ghaffarzad claimed that INR is higher in more conscious people (10). Furthermore, Ziaeirad showed that INR is related to death (3). In another study, Liu asserted that in the multivariate model, only the high number of platelets is related to unfavorable outcomes (15). According to Nelson, INR has no significant relationship with unfavorable outcomes (24). Yuan declared that the result of blood coagulation tests could be a strong predictor for hospital death and is regarded as a better predictor for routine variables on admission, among which PTT and INR are considered the strongest (28). In the present study, the results are almost consistent. PTT, PT, and INR had higher values in the non-survivor group than the other group. Fluctuations in the two groups were not significantly different and the difference was significant only on admission. The value of blood coagulation markers should be regarded on admission.
FBS: Based on the results, a significant relationship was reported between high glucose levels and death or unfavorable outcome (15, 20, 21, 28). In the present study, high glucose is observed in the non-survivor group. However, the two groups' mean and changes are not significantly different. In this study, Glucose levels were missing in about 30% of the samples.
WBC: This variable is observed in many clinical studies, and its predictability for death or unfavorable outcome and its relationship with the value of GCS is significant. Based on the results, elevated WBC is more among people with low consciousness (9, 23, 25). High WBC is related to unfavorable outcomes, longer hospital stays, and death (10, 23, 27). Only Liu failed to prove a significant relationship between WBC and unfavorable outcomes (15). In the present study, high WBC is observed in the non-survivor group. No significant difference was observed in the mean on admission and dispersion of values.
PR and RR: Ziaeirad reported high death-related PR (3). Some studies indicate that GCS and PR are good and well-known signs of disease prognosis (24). In addition, Manoel claimed that a high respiratory rate (RR) above 20 is considered a strong predictor for death and a strong measure of the length of hospital stay (22). In the present study, high PR and low RR are observed in the non-survivor group, which is clearer in the distinction between the two groups for PR. The dispersion of values for both markers was significantly different in the two groups. However, only the mean of PR on admission was significantly different in the two groups. Considering the fluctuations in the two groups during hospitalization plays a significant role in predicting the patient's condition.
PH: This variable is less common in studies, and the results are inconsistent. Van Beek found that PH is inversely related to unfavorable outcomes (21). According to Nelson, PH was not significant in multivariate regression (24). In the present study, PH is less, while its mean on admission and fluctuations are not significantly different between the two groups.
GCS: In all studies, GCS is introduced as a strong predictor for hospital death or unfavorable outcome among TBI patients (2, 3, 15, 29, 31). The predictive power of GCS is much better and more accurate when combined with age or CT scan findings (11, 24, 32). The distinction between the two groups is clearly observed in the present study. The value of GCS on admission and its dispersion in the two groups is significantly different.
BP: Shibahashi proved the relationship between low blood pressure (systolic) during admission and hospital death, indicating that the cutoff point depends on age (31). Ssebakumba showed that systolic BP > 90mmHg at admission was statistically significant outcome determinant (19). In the present study, systolic and diastolic blood pressures differed during admission, and their value was more dispersed in the non-survivor group. However, the large overlap in the graph
Age: The risk of death due to TBI is higher for older people, although TBI is more common among young people (15). The risk of death or unfavorable events increases with age (1-3, 9, 14, 15, 24, 28, 33). Hukkelhoven investigated the exact relationship between age and disease outcome 6 months after discharge and proposed second-order and simple linear models. According to Hukkelhoven, age is a vital variable in prognosis and not just a controlling factor (14). These results are in line with those of the present study.
Gender: This variable is not an essential factor in predicting the outcome of death or an unfavorable accident in most studies and the present (1, 3, 9, 24, 31). Generally, gender has no significant relationship with death due to TBI, although the percentage of men with TBI is higher (2).
SDH, SAH, and EDH: There was no complete agreement regarding these variables. Some studies found a significant relationship between death and an unfavorable accident (3, 23, 28), and some did not (3, 15). Scotter performed a systematic review and meta-analysis on patients with bilateral fixed and dilated pupils who underwent surgery. They showed low mortality rates in patients with extradural haematoma (34). Ssebakumba established that AEDH is more frequent than ASDH among patients and found that patients with AEDH were 53% more likely to have a favorable outcome. Diagnosis of AEDH at admission was the primary determinant of favorable outcome (19). Leitgeb (2012) studied patients with moderate and severe TBI (GCS<9) with EDH in 17 Austrian centers during the last 9 years. The Rotterdam score was used to classify CT findings. Mortality rates predicted by the Rotterdam score positively correlated with observed mortality rates. This study demonstrates that EDH in patients with severe TBI is still associated with considerable mortality and morbidity (35). In the present study, the relationship between SDH, SAH, and ICH were critical predictors for hospital death.
Tachycardia: This variable is a vital sign. Liu found a significant relationship between tachycardia and unfavorable outcome (15). In the present study, tachycardia was considered a critical and significant variable on admission for distinguishing the two groups in both univariate and multivariate models was highly significant.
Performing the study retrospectively is regarded as an important constraint. Generally, the number of pages with duplicate descriptions was in the file, and the writing was illegible. To solve this problem, the writings of nurses, doctors, and CT scans were used simultaneously for coordination. However, the laboratory results were legible and typed. There are missing data, and some tests did not do on time. CT scan was performed once during hospitalization and was not repeated during hospitalization to indicate secondary injury. There was no result of the MRI. The power of the present study includes many variables belonging to one patient that occurred simultaneously and continuously.
In contrast, previous studies examined only one or more biomarkers or CT-scan results cross-sectionally. It was better to assess the interaction between them. There are some electrolyte disturbances simultaneously, and they are related to each other. The relationship between and the disease outcome can be assessed since there are several electrolyte disturbances in tachycardia patients, and these values are interdependent.
Conclusion
Based on the results, the factors such as age, tachycardia, and some CT-scan findings (SAH, ICH, and SDH), as well as high coagulation profile (INR, PTT) and low GCS on admission, are important variables to the prognosis of TBI patients. During hospitalization, high values of BUN, PR, Cr, FBS, PT, and INR and low values of GCS, RR, and PH are associated with a worthwhile outcome. In addition, high BUN, GCS, RR, PR, and BP changes during hospitalization should be considered a worthwhile prognosis.
Acknowledgements
Thanks to Shohada- E- Tajrish Hospital management, we allow to do this project.
Conflicts of Interest
The authors declare no conflict of interest.
Funding
None Declared.
Received: 2022/08/4 | Accepted: 2022/12/27 | Published: 2023/09/27
| Rights and permissions | |
 |
This work is licensed under a Creative Commons Attribution-NonCommercial 4.0 International License. |
Copyright Policy
