


BibTeX | RIS | EndNote | Medlars | ProCite | Reference Manager | RefWorks
Send citation to:
URL: http://journal.zums.ac.ir/article-1-5748-en.html


2- Vali-e-Asr Hospital, School of Medicine, Zanjan University of Medical Sciences, Zanjan, Iran
3- Dept. of Neurology, Vali-e-Asr Hospital, School of Medicine, Zanjan University of Medical Sciences, Zanjan, Iran
4- Dept. of Otorhinolaryngology, Vali-e-Asr Hospital, School of Medicine, Zanjan University of Medical Sciences, Zanjan, Iran
Over the past century, the natural environment has been strongly influenced by manufactured low-frequency electromagnetic fields. An increasing trend in environmental radiation is observed with the development of technology. Mobile phones are one of the sources of these fields. The widespread use of these communication systems has attracted attention to their biological effects (1,2).
The waves given off by mobile phones influence human cells and tissues thermally and non-thermally (4). Effects caused by heat are due to the effect of oscillations of the magnetic field and its interaction with body tissues. This increase in temperature is associated with the position and frequency of the mobile phone. The non-thermal effect is due to the influence of the magnetic field on different cells. The magnetic field polarizes each cell and changes it into two bipolar cells. These effects impair cell metabolism and function, lead to structural changes in cellular membranes, and increase pores in blood-brain barrier (BBB) and its permeability (5-8). Researchers have attributed such health complications as headaches, a feeling of heat around or behind the ears or on the face (9), and changes in BBB permeability (10), salivary flow rate, and oral mucosal cells (11) to the thermal effects of electromagnetic waves. On the other hand, problems such as changes in sleep patterns in electroencephalogram (EEG) (12), blood pressure, and cognitive and functional disorders have been attributed to the non-thermal effects of waves (10,12,13). Different studies have provided different results about the impact of these waves on the central nervous system and the development of brain tumors, especially acoustic neuromas. Some studies have shown a correlation (14,15), and some have not (7,14,16). Meanwhile, others have shown none of the effects mentioned above (e.g., headache; tinnitus; or sensations of burning or warmth behind, around, or on the phone-using ear) (17).
Since the temporal lobes and cochlear nerves have the greatest exposure and are anatomically near waves emitted from mobile phones, the auditory system has the potential to be influenced by these waves (18,19). Different studies have investigated the effect of microwave radiation on the auditory system of animal and human models, most of which have investigated the effects of short-term exposure to these waves. Some surveys showed that the wave had no significant influence on the auditory system of animal models (20). However, in a study conducted on an animal sample, after a week of being exposed to the waves and testing by auditory brainstem response (ABR), the wave V latency in all frequencies had increased by more than 0.2 ms. At the end of the second week, the wave V latency decreased in high frequencies and returned to a near-normal level, which could be due to the resiliency and hearing compliance of animals at these frequencies (21).
In another study, rats were exposed to a 2100-MHz electromagnetic field for 30 days. Although no significant effect on ABR was found, some histopathological and immunohistochemical effects (e.g., increased apoptotic index and consecutive degeneration) were seen (22). In addition, some studies showed that the prolonged use of mobile phones is directly related to hearing complaints among users (23). Other studies investigating pure tone audiometry (PTA) showed that the greater the rate of cell phone use during the day, the greater the possibility of hearing loss occurring, especially at high frequencies (24,25).
There have been numerous studies on the effects of these waves on the human auditory system with varying results. Using ABR, some researchers investigated the short-term effects of radiation of the waves on a small number of samples with different times from 10 to 30 minutes. Most of these studies showed that the waves could not much influence the auditory system in the short term from the auditory nerve to the brain stem (19,26-29). However, one study showed that wave V latency in ABR increased by 0.207 after 15 minutes of exposure to mobile phones (30). Another study revealed that there was a relationship between exposure to mobile phone electromagnetic waves and changes in the ABR test and other hearing tests (31-33). One study evaluated long-term using of mobile phones (more than 1 year) and reported no effect on latencies, interpeak intervals and amplitudes of ABR waves between cases and controls (34). Previous studies largely focused on the short-term effects of electromagnetic waves from mobile phones on human auditory system. A few studies intended to evaluate the effects of these waves on the hearing tests in subjects who had used mobile phones for more than three years (31) or more than 4 years (17). Therefore, given the lack of adequate studies on the long-term effects of the waves on the human auditory system, this study aimed to investigate, retrospectively, the effects of electromagnetic waves on the ABR and PTA tests following a prolonged exposure.
There was only one inclusion criteria: people in the age range of 15-45 years, who were able to participate in hearing tests in terms of awareness level. Exclusion criteria included the following: telecommunications antennas near home or workplace, typical use of hands-free during calls (in over 20% of calls), hearing disorders in first-degree family members, history of severe head trauma, history of a prolonged period of loss of consciousness, history of ear surgery, history of ear drainage, history of long-term exposure to loud noises or sudden contact with a loud noise, history of using ototoxic drugs within the last month (aminoglycosides, erythromycin, tetracycline, chloroquine, sildenafil, cocaine, and regular intake of aspirin or acetaminophen), history of Meniere (alternating periods of hearing loss, vertigo, and tinnitus), history of anemia, diabetes mellitus, central and peripheral nervous system diseases (multiple sclerosis (MS), cerebrovascular accident (CVA), and transient ischemic attack (TIA)), hyperthyroidism or hypothyroidism, history of barotraumas, any problems in examination by otoscopes such as abnormalities in the anatomy of the outer ear and eardrum, inflammation or accumulation of fluid behind the eardrum, the presence of wax in the outer ear blocking the auditory pathway, torn eardrum, and proved hearing loss after PTA test.
Each participant was evaluated based on the following variables: results of ABR, results of PTA, average daily use of mobile phones, number of years of use, age, gender, neural hearing complaints (such as headache), and the preferred ear of use.
In terms of the average daily use of mobile phones, 96 participants in the survey were divided into three groups (32 users in each) as low (less than 30 minutes), moderate (30-60 minutes), and high (greater than 60 minutes). Moreover, in another classification according to the years of use, the participants were divided into three groups of below 6 years, 7-9 years, and more than 10 years.
First, PTA test was performed in the audiometry center of the Zanjan Vali-e-Asr hospital. The test was performed using a digital audiometer (FONIX-FA 12, the US). An audiologist conducted the test and an ENT specialist observed the test being fixed on all cases from the beginning to the end of the test. The testing place was impervious to ambient sounds. After clearly explaining how to perform the test and proper placement of phones on the ear, the hearing threshold level in 250, 500, 1000, 2000, 4000, and 8000 Hz frequencies in the right ear was measured by sending pure tones. If the patient responded to at least half of the sent tones at that intensity, the intensity would be recorded. Then, the same process was performed on the left ear. If the hearing thresholds were higher than the normal level, bone conduction would be measured by placing a Bone Vibrator. If there was a difference between air and bone conduction, the patient would be excluded due to conductive hearing loss, which did not happen in any of the participants.
As defined by the American National Standards Institute (ANSI), hearing threshold lower than 15 dB is considered normal, and abnormal hearing thresholds were defined as minor (16-25 dB), mild (26-40 dB), moderate (41-55 dB), moderate to severe (56-70 dB), severe (71-90 dB), and deep (over 90 dB) hearing loss. Furthermore, if the hearing threshold was higher than the normal level in one or more frequencies, the PTA test was considered abnormal for that person on that side.
Following that, ABR test was performed using Electromyography NIHON KOHDEN MEB-9402 with a serial number of 00327 in the neuro-electrodiagnostic center of Zanjan Vali-e-Asr hospital. Impedance or inter-electrode resistance was kept below 5 kilo-ohms. The device setting was such that click acoustic stimuli with the intensity of 90 dB and 50 dB were sent to the stimulated ear and the other ear, respectively, in order to mask it with a duration of 0.1 ms for each click and a speed of 10 Hz. Lower and upper limits of filtered frequencies were between 100 and 3000 Hz. The average of 1000 clicks was recorded as ABR waves. Auto reject system of artifacts was used to reduce muscle activities recorded on the average. If more than 100 clicks were rejected by the device, the test did not continue.
In order to reproduce the same waves, ABR test was performed twice on each side in each individual. Waves I, III, and V latency, and interval time of generating I-III, III-V, and I-V waves were compared. If a specified threshold was higher than the defined level, it was considered an abnormal wave. Also, if the latency of each of these waves was abnormal or the difference between right and left in each wave (Inter-side Difference) was more than 0.4 ms, ABR test was considered abnormal in that person.
Analysis
Data were analyzed by SPSS V.18 software (IBMSPSS statistics, IBM Inc, New York, USA). Data were presented as: number, percent, mean, and SD. Chi-Square (for qualitative variables), ANOVA (for the quantitative variables with normal distribution), and Kruskall-Wallis (for quantitative variables without normal distribution) tests were used. P-values less than 0.05 were considered as statistically significant.
Ethical Considerations
Although the tests were harmless, a written informed consent was taken from all the participants.
Design constraints and strategies to reduce them
- Lack of cooperation of the participants to fully perform the tests; To overcome this limitation, in addition to discussing the safety of the tests, we tried to assure people that participating in the study would inform them of their hearing state free of charge.
- Inaccuracies in testing, especially in the PTA test; To reduce this constraint, we transferred our desired sensitivity and accuracy in audiometry testing to the person in charge. Moreover, the audiometric expert in charge was one single person from the beginning to the end of the study, ensuring test consistency.
- Potential error in the results of ABR and a lack of the ability to reproduce the same waves; In order to overcome this, other than removing parasites and confounders, an ABR test was conducted twice on each side per participant (with 1-2 hours interval) to increase test reliability.
- Lack of access to the documents of Telecommunications Centre on average daily conversations via mobile phone.
Out of 96 participants, 21 users (21.9%) experienced a headache. It should be noted that other neural and auditory complaints such as tinnitus, a feeling of heat around the ears, earache, and temporary hearing loss after a phone call were not present in the subjects. The average duration of using mobile phones was 7.5±2.4 years. The right ear was preferred ear of use exhibited in 42 patients (43.8%). Also, 39 patients (40.6%) preferred both ears.
There was no significant difference between the average daily minutes of mobile phone use and the frequency of headaches (P=0.93 ANOVA).
Average wave latency and the interval between them, in terms of mobile phone use, revealed that significant differences only existed between mobile phone use and wave Ⅲ (P=0.04), and wave Ⅴ (P=0.03) latency in the right ear (Figures 1 and 2). Since abnormal values were observed only in wave I, its relationship with other variables was studied. There was no significant difference between abnormal results of wave I in ABR test and the average daily use, the number of years of use, and gender (P>0.05 Chi-Square).
Chi-square test disclosed no difference between inter-side difference of ABR wave latencies according to average daily use, the total duration of use in years, and gender.
Table 1 displays the frequency distribution of the overall ABR test results in terms of the average daily use, number of years of use, and gender. According to the definitions and listed numbers, it is worth noting that abnormal cases were defined as any abnormalities in each of the six components of waves I, II, and V latency, and interval time of generating I-III, III-V, and I-V waves as well as inter-side difference. The overall results of ABR tests revealed no significant difference.
Frequency distribution of PTA test results of the right and left ears are presented in Table 2 according to average daily time use, years of use, gender, and preferred ear of use during phone calls. In this table, if the hearing threshold is higher than the normal level in one or more of the frequencies, the PTA test was considered abnormal on that side for the patient. In the case of the right ear, there was only a significant difference between abnormal PTA test results and average daily use (P=0.054). In case of the left ear, there was a significant relationship between abnormal results of PTA with years of use (P=0.01) and the preferred ear of use during phone calls (P=0.02).
The comparison of normal and abnormal hearing thresholds of the right and left ears in 250, 500, 1000, 2000, 4000, and 8000 Hz based on the daily use of mobile phones has been presented in Table 3. The only significant or near significant relation was observed in the right ear and only in 8000 frequency between the hearing threshold values with daily use of mobile phones (P=0.06).
If any of ABR and PTA tests of each person’s right and left ears were abnormal, the person was labeled as abnormal, and their frequency was investigated based on the average daily use of mobile phones and number of years. In low users, 15 cases had an abnormal test (28.3% of all abnormal results) and 17 cases had a normal test (39.5% of all normal results). In moderate users, 20 (37.7%) cases showed abnormal tests and 12 (27.9%) cases were normal. Finally, in high users, 18 (34%) cases had abnormal tests and 14 (32.6%) cases had normal tests (P=0.45). According to the years of use, 13 (24.5%) cases had abnormal tests and 17 (39.5%) cases had normal tests in ≤6-year users. In 7-9 year users, 29 (54.7%) cases had abnormal tests and 19 (44.2%) cases showed normal tests. And in ≥9 year users, data demonstrated 11 (20.8%) abnormal tests and 7 (16.3%) normal tests (P=0.29). No significant relationship was found in any of these cases
Table 1. Distribution of ABR test overall result in terms of average daily use, number of years, and gender
| P-value | Abnormal (%) | Normal (%) | Variable |
| 0.91 |
4 (30.8) 5 (38.5) 4 (30.8) |
28 (33.7%) 27(32.5%) 28(33.7%) |
Daily use low moderate High |
| 0.53 |
5 (38.5) 7 (53.8) 1 (7.7) |
25 (30.1%) 41(49.4%) 17(20.5%) |
Years of use ≤ 6 years 7-9 years 10 years ≥ |
| 0.94 |
8 (61.5) 5 (38.5) |
52(62.7) 31(37.3) |
gender male female |
Table 2. Distribution of PTA test results on left and right side in terms of average daily use, number of years, gender, and preferable ear of use during phone calls
| P-value | Abnormal (%) | Normal (%) | Variable |
|---|---|---|---|
| 0.05 0.69 |
9 (23.7) 18 (47.4) 11 (28.9) 7 (26.5) 9 (34.6) 10 (38.5) |
23(39.7) 14 (24.1) 21 (36.2) 25 (35.7) 23 (32.5) 22 (31.4) |
Daily use PTA test results on Right side: low moderate High PTA test results on Left side: low moderate High |
| 0.23 0.01 |
10 (26.3) 23 (60.5) 5 (13.2) 3 (11.5) 13 (53.8) 9 (34.6) |
20 (34.5) 25 (43.1) 13 (22.4) 27 (37.6) 34 (48.6) 9 (12.9) |
Years of use PTA test results on Right side: ≤ 6 years 7-9 years 10 years ≥ PTA test results on Left side: ≤ 6 years 7-9 years 10 years ≥ |
| 0.91 0.91 |
24 (63.2) 14 (36.8) 24 (63.2) 14 (36.8) |
36 (62.1) 22 (37.9) 36 (62.1) 22 (37.9) |
Gender PTA test results on Right side: male Female PTA test results on Left side: male Female |
| 0.30 0.02 |
4 (10.5) 20 (52.6) 20 (52.6) 8 (30.8) 7 (26.9) 11 (42.3) |
11 (19) 22 (37.9) 25 (43.1) 7 (1) 35 (50) 28 (40) |
preferable ear of use PTA test results on Right side: Right Left Both PTA test results on Left side: Right Left Both |
| Average daily use | Number of cases with normal hearing threshold (%) | Number of cases with hearing threshold loss (%) | P-value | ||
| Frequency of 250 Hz | Right Ear | Low | 26 (33.3) | 6 (33.3) | 0.44 |
| Moderate | 24 (30.8) | 8 (44.4) | |||
| High | 28 (35.9) | 4 (22.2) | |||
| Left Ear | Low | 28 (32.6) | 4 (40) | 0.06 | |
| Moderate | 26 (30.2) | 6 (60) | |||
| High | 32 (37.2) | 0 (0) | |||
| Frequency of 500 Hz | Right Ear | Low | 30 (31.9) | 2 (100) | 0.13 |
| Moderate | 32 (34) | 0 (0) | |||
| High | 32 (34) | 0 (0) | |||
| Left Ear | Low | 32 (33.7) | 0 (0) | 0.36 | |
| Moderate | 31 (32.6) | 1 (100) | |||
| High | 32 (33.7) | 0 (0) | |||
| Frequency of 1000 Hz | Right Ear | Low | 32 (33.7) | 0 (0) | 0.36 |
| Moderate | 31 (32.6) | 1 (100) | |||
| High | 32 (33.7) | 0 (0) | |||
| Left Ear | Low | 32 (33.7) | 0 (0) | 0.36 | |
| Moderate | 31 (32.6) | 1 (100) | |||
| High | 32 (33.7) | 0 (0) | |||
| Frequency of 2000 Hz | Right Ear | Low | 32 (33.7) | 0 (0) | 0.36 |
| Moderate | 31 (32.6) | 1 (100) | |||
| High | 32 (33.7) | 0 (0) | |||
| Left Ear | Low | 32 (33.7) | 0 (0) | 0.36 | |
| Moderate | 31 (32.6) | 1 (100) | |||
| High | 32 (33.7) | 0 (0) | |||
| Frequency of 4000 Hz | Right Ear | Low | 28 (37.8) | 4 (18.2) | 0.19 |
| Moderate | 22 (29.7) | 10 (45.5) | |||
| High | 24 (32.4) | 8 (36.4) | |||
| Left Ear | Low | 26 (33.3) | 6 (33.3) | 0.44 | |
| Moderate | 28 (35.9) | 4 (22.2) | |||
| High | 24 (30.8) | 8 (44.4) | |||
| Frequency of 8000 Hz | Right Ear | Low | 29 (35.8) | 3 (20) | 0.06 |
| Moderate | 23 (28.4) | 9 (60) | |||
| High | 29 (35.8) | 3 (20) | |||
| Left Ear | Low | 30 (36.6) | 2 (14.3) | 0.10 | |
| Moderate | 28 (34.1) | 4 (28.6) | |||
| High | 24 (29.3) | 8 (57.1) | |||
.png)
Figure 1. Comparison of waves latencies and interwaves intervals in left ear according to average minutes of daily mobile use
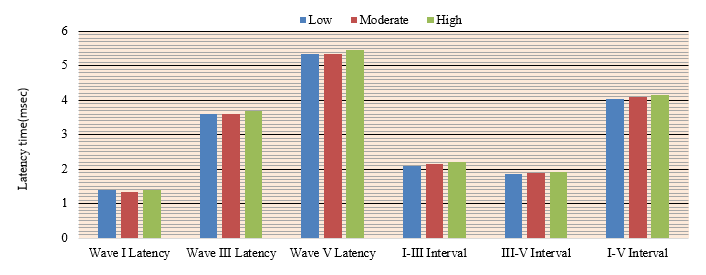
Figure 2. Comparison of waves latencies and intervals between them in right ear in terms of average minutes of daily mobile use
Discussion
Of the complaints investigated, only headaches were mentioned among the subjects. Despite the high prevalence of headaches in mobile phone users, their relationship with the use of mobile phones was not statistically significant. However, in a study by Chia SE et al. (35), which used a larger sample size, a direct relationship was indicated between headaches and the duration of using mobile phones. In our study, this relationship was not observed because of the fewer participants in performing auditory tests.
Many studies have evaluated the effects of electromagnetic waves on the human acoustic system and reported varying results. Using the ABR test, some researchers studied the short-term effects of radiation exposure on a limited number of samples at different times (10 to 30 minutes). Most of these studies, such as those carried out by Oysu C et al. (28) and Sievert U et al. (29), showed that the waves given off by mobile phones do not significantly influence the auditory system from the eighth cranial nerve to the brainstem in the short term. This may be why Oktay et al. (25) and Gupta et al. (34) studied the effects of long-term exposure to the waves. We also evaluated the long-term effects of exposure to
Regarding ABR, different sources have stated that normal values for latency and interwave intervals could be different based on the test conditions and device settings. We evaluated the latency of waves and the intervals within each group (low, moderate, and high use of mobile phones), and the normality or abnormality of the test based on available resources and definitions for the device.
A comparison of the test results with normal values revealed no significant effect of higher mobile phone use. However, when the average latencies of waves in each group of users were compared, a longer interval between waves III and V was seen in the right ear in the high-use group. This finding indicates that there is a significant relationship between mobile phone use and the latency of the waves. Although Panda N et al. (31) did not find this relationship through ABR results, distortion product otoacoustic emission (DPOAE) and middle latency response (MLR) results revealed that the long-term use of mobile phones could harm the cochlea and auditory cortex. Although this study included a control group, it included only participants who had used mobile phones for more than a year. Therefore, no detailed comparison was made in terms of use.
Oktay et al., among other studies, evaluated the interval between ABR waves and the use of mobile phones. They observed no significant relationship between these variables (25). However, in this study, the latency of waves III and V, which was significant in our study, was not measured. The increased latency indicated by the ABR test could signify retrocochlear pathologies and impaired voice message transmission. A prolonged latency of wave III indicates the impaired transmission of voice messages to caudal pontine tegmentum and the superior olivary nucleus. Also, the excessive latency of wave V implies a disturbance in the transmission of voice messages to the lateral lemniscus and inferior colliculus.
Another test used in this study was the PTA test. Since this is a subjective and quick test that evaluates overall hearing performance, it is widely used in clinical studies. In this study, the hearing threshold of each ear of the participants in each group was measured based on use at frequencies of 250, 500, 1000, 2000, 4000, and 8000 Hz. The results were near significant only at the 8000 Hz frequency for the right ear. Conversely, Oktay et al. showed that this relationship was more significant at 4000 Hz frequencies on both sides. Nevertheless, our results are consistent with the fact that hearing loss often occurs at high frequencies in cases of noise-induced hearing loss or chronic mobile phone use (25).
One of the strengths of this study is that it considered each participant’s preferred ear of use during phone calls. On the other hand, since the formation of some ABR waves (especially wave Ⅴ) is related to auditory pathways on both sides, the preferred ear was not compared using the data of this test but was measured solely by PTA test results. An important finding of this study is the association between abnormal PTA results in the left ear and preferred use on the same side.
Comparing the PTA data for either preferred ear in those who use one ear more than the other during phone calls can minimize the effect of other factors that affect hearing and highlight the possible effect of mobile phone use duration on hearing damage.
Another variable investigated in this study was gender. There was no relationship between ABR or PTA results with gender. Moreover, to examine the cumulative effects of mobile phone use, we evaluated the ABR and PTA test results based on the number of years of mobile phone use. Our results showed that there was a relationship between the use of mobile phones and abnormal PTA results in the left ear. However, this relationship was not seen for the right ear for either the PTA or ABR test. Differently, Singh K revealed a difference between right and left ear preference regarding brainstem auditory evoked potential. He showed increasing latencies of II, III, and V waves, the amplitude of I-Ia waves, and a decrease in the interpeak interval of III-V waves after mobile phone exposure in the right ear. In comparison, no change in the waves of the brainstem auditory pathway was seen in the left ear after mobile phone use. This might be due to the short duration of exposure to electromagnetic waves (about 10 minutes) (36).
In line with the previous studies, this study aimed to evaluate the long-term effects of exposure to electromagnetic waves produced by phone calls on the auditory-nerve system along with removing some of the shortcomings of previous studies. A limitation of this study was a lack of precise official data about the rate of daily phone calls of the participants, and therefore, we had to rely on the subjects’ self-citations. Although there were very strict criteria for the selection of samples, there might be some drawbacks of hearing to distort the results of the tests.
Conclusion
Although there is little evidence of the harmful effects of the electromagnetic waves produced by cell phones, this study disclosed that the prolonged use of mobile phones could affect auditory pathways from the cochlear nerve to the brainstem. Although the effects were minor and subclinical, the long-term use of mobile phones could lead to hearing impairments at high frequencies. Therefore, since this technology has become an integral part of human life, it is recommended that people use mobile phones only when necessary and for short durations; people should use landline phones instead of mobile phones as often as possible. Moreover, using a hands-free during phone calls or when sending text messages is another way to reduce the harmful effects of exposure to cell phone waves. Finally, parents are encouraged to prevent their children from exposure to cell phone waves as much as possible.
Acknowledgements
This study was supported by Zanjan University of Medical Sciences. The authors would like to thank the personnel of the Department of Neurology for their help in this study and all persons for participating in this study.
Conflicts of Interest
The authors declared no potential conflicts of interest with respect to the research, authorship, and/or publication of this article.
Received: 2019/08/12 | Accepted: 2019/12/10 | Published: 2020/01/5
| Rights and permissions | |
 |
This work is licensed under a Creative Commons Attribution-NonCommercial 4.0 International License. |
Copyright Policy
