


BibTeX | RIS | EndNote | Medlars | ProCite | Reference Manager | RefWorks
Send citation to:
URL: http://journal.zums.ac.ir/article-1-6037-en.html


2- Iranian Center of Excellence in Health Management School of Management and Medical Informatics, Tabriz University of Medical Sciences, Tabriz, Iran ,
✅ The results show that a high percentage of FOSS projects against COVID-19 were related to visual dashboards. The open dataset and analytical methods made a significant contribution to this context. Previously learned lessons from FOSS have shown that the explained projects would play important roles in future epidemics by forking and joining in new projects, which formed around a specific problem.
The disease caused by the novel coronavirus (COVID‐19) was first observed in December 2019 in Wuhan, China. COVID-19 is considered to be transmitted by respiratory droplets and direct contact. By May 27, 2020, a total of 5,718,885 infected cases had been confirmed, affecting 215 countries and territories globally (1, 2). Now, worldwide efforts are focusing on dealing with the emerging COVID-19 pandemic. To accelerate scientific efforts and overcome the challenges of current and future health threats, it is necessary to use information technology (IT)-related data and analytics capabilities (3). Recent advancements in health IT are completely improving the potential to identify and detect unpredicted disease outbreaks and pandemics. Hopefully, IT can be applied to meet challenges related to the disease and biosurveillance (4). However, researchers have mentioned during the COVID-19 crisis that any global health disasters are also information disasters that require more attention in the IT field (5). For example, in an infectious disease outbreak, gathering, sharing, and analyzing accurate and real-time data about cases with the disease and their additional information are important for effective and evidence-based interventions (6). To master the soaring demand for an agile response, epidemic events always require instant information generation, exchange, and analysis involving strong cooperation between various stakeholders. Collaborative IT is the main actor in this context. Social networks, as well as computational, visualization, and sharing platforms, are useful and accessible technologies in difficult times. In healthcare-related recovery endeavors, free and open-source software (FOSS) systems have emerged as an effective tool against these challenges for cross-sectional or organizational applications (7).
Many FOSS platforms were developed in previous epidemic events and disasters. The researchers stated five valuable features of FOSS in health informatics efforts, namely no access discrimination, trust and transparency, low cost and local capacity, shared interorganizational development, and adaptability. FOSS eliminates download limitations and is widely available for health activists around the world. Also, the development mechanism in FOSS is clear and trustworthy with global team collaboration. Therefore, FOSS is resistant to any political and economic events. FOSS helps reduce digitalization costs because there is no additional cost for the product design and development. To maintain the software, local and national capacity can be engaged by health policymakers. Additionally, all organizations, including non-governmental organizations (NGOs) and humanitarian relief groups, need informatics tools to be efficient. But most of these organizations do not have the budget required to purchase expensive commercial software. Health FOSS can be designed and implemented globally when a disaster like COVID-19 strikes. The last advantage is adaptability. Countries have different approaches to handling quick responses in a health disaster. With FOSS, any country can modify and customize it to suit its own national priorities (8). Studies on other epidemics, such as Ebola (9, 10) or severe acute respiratory syndrome (SARS) (11) have shown that open-source software was able to support in the fight against one of the most lethal pandemics of recent days, and it can likely be used in the COVID-19 situation. Using open-source products can save a lot of time and money, and so it can be essential for global organizations (12).
According to the importance of the unified and integrated approaches to handle epidemic disasters by applying FOSS potential, this paper presents a review of recent open-source efforts and products against the COVID-19 pandemic. The main objective of our study was to determine and summarize the application of FOSS in published and released resources and materials against COVID-19.
Inclusion criteria
This review included projects that were available through GitHub, SourceForge, and Google Scholar recently indexed materials. Projects were included if they: (i) were released or published in 2020 (ii), focused on COVID-19 or related topics (iii), were in English or translatable, and (iv) had a repository that consisted of source codes and detailed descriptions. Projects without any information about the aims and applications against COVID-19 were removed.
Search Strategy
The study sample was identified through systematic searches in GitHub, SourceForge, and Google Scholar. All projects were identified between January 1 and April 10, 2020. Two reviewers (TSS, PR) screened the apps at the same time. Search terms in GitHub and SourceForge were based on clinical terminologies, such as COVID-19, COVID, Covid19, and Corona Virus.
Screening Procedure
Since the screening procedure for GitHub was different from that of SourceForge, the screening procedures were reported separately. In GitHub, the projects were included for review if they had more than 300 stargazers or had been forked more than 300 times or continuously updated. In SourceForge, projects with more than 10 downloads in the last week (updated less than one month ago) were included. Figure 1 provides an overview of the selection process.
The reviewers detected 46,426 projects in GitHub and seven projects in SourceForge. The inclusion and exclusion criteria were applied to the results. Finally, 40 projects were chosen for qualitative analysis (Figure 1).
A total of 40 projects were identified (GitHub=38, SourceForge=2) as active and growing. Table 1 shows a summary of FOSS projects. The mean number of stargazers per software in GitHub was 1.44k (range 61–20.2k), and the mean software forks rating was 616.26 (range 25–10.9k). The mean number of downloads in the last week in SourceForge was 47. Also, out of 40 software programs, 13 had the MIT License, and 57.5% of the stakeholders were volunteers. Most of the software packages have been designed for researchers, public health institutes and organizations, and the at-risk population to apply a usable tool to track the COVID-19 outbreak. They allow users to visualize prevalence estimates on a world map and compare estimates between regions, population groups, and modes of testing. The software data allows the user to generate evidence for planning, modeling, and epidemiological studies. Also, key considerations in combating the COVID-19 outbreak, such as when and how to enhance tracking, response efforts, and resource distribution are offered.
Twenty-eight GitHub software programs were categorized as follows: Business Intelligence and Visual Dashboards (23.68%), Time-Series (13.15%), Artificial Intelligence (10.52%), Epidemiological Approaches (10.52%), Web Services (21.05%), etc.
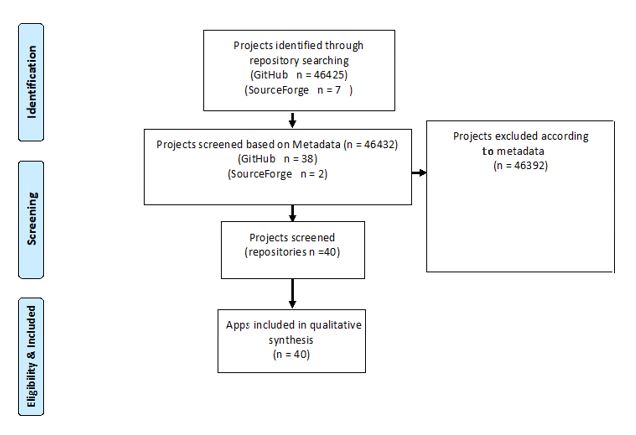
Figure 1. The selection flow diagram of FOSS projects
Table 1. Summary of top FOSS projects against COVID-19*
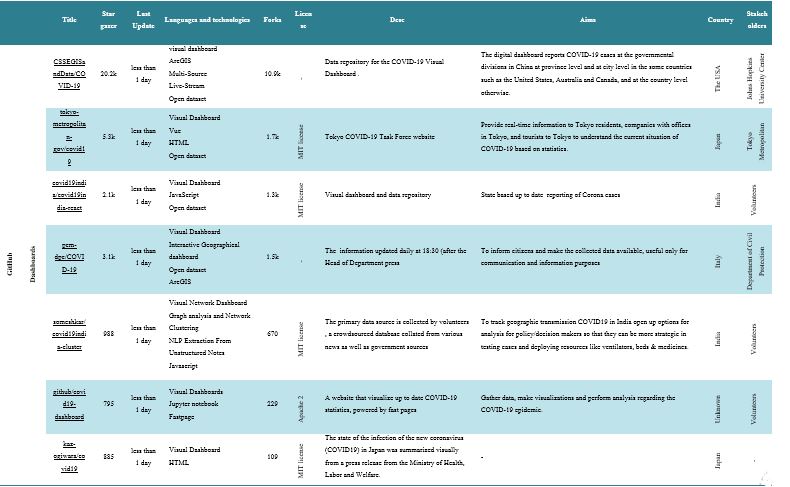

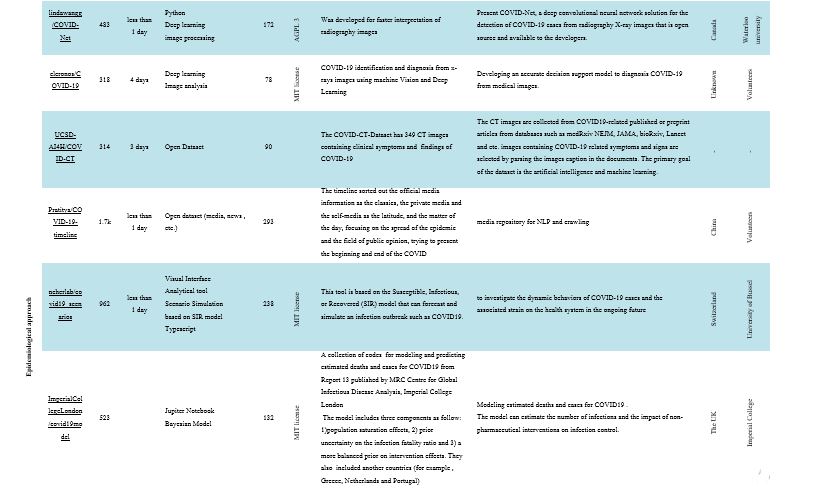
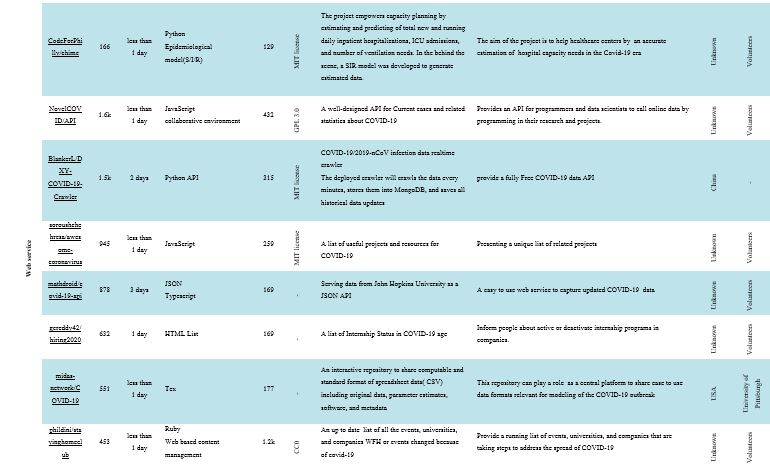
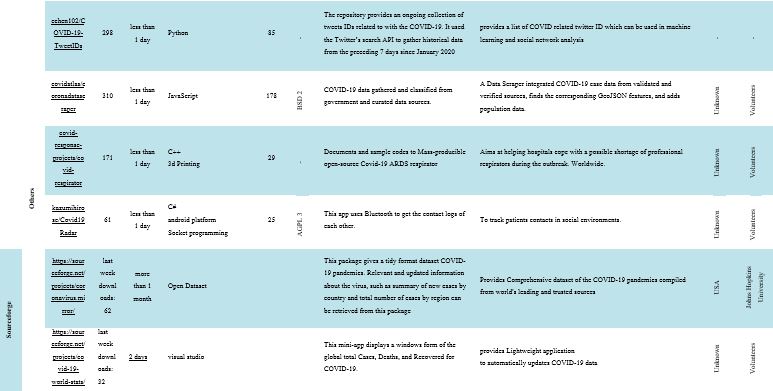
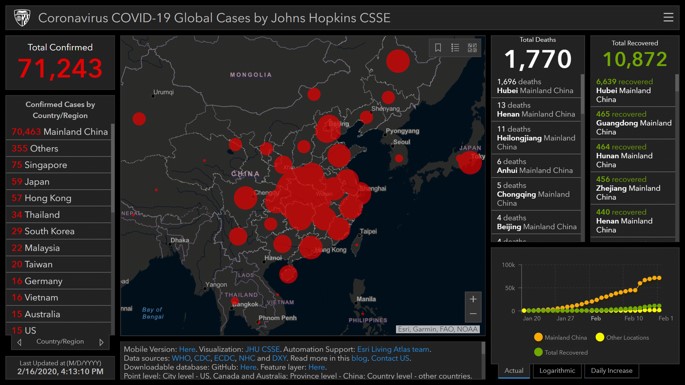
Figure 2. JHU CSSE. Screenshot date: 16 February 2020 (15)
Discussion
The current review aimed to investigate the use of FOSS against COVID-19 available through GitHub and SourceForge. The 40 projects included in the review encompassed five different scopes, including Business Intelligence and Visual Dashboards, Time-Series, Artificial Intelligence, Epidemiological Approaches, and Web Services.
Business intelligence and visual dashboards
Business intelligence (BI) is a platform covering all information systems (IS) committed to providing decision support by collecting and aggregating raw data obtained from the operating systems. BI tools, such as dashboards, are an essential method of data visualization for presenting a visual overview of information to facilitate new usable viewpoints to improve decision-making or management (13). A dashboard offers a means for various visual elements to view and interpret information promptly. They can also save time and money when making decisions, provided that a dashboard can synthesize many details (14). When diseases can be transmitted so quickly, knowledge needs to move even more quickly. Here, map-based dashboards are becoming crucial (15). Most of the software in the present review utilizes the dashboard.
For example, in “CSSEGISandData/COVID-19”, which has the highest stargazers (20.2k) and forks (10.9k), the dashboard is used in real-time to imagine and monitor confirmed cases of COVID-19. The report, which was first publicly released on January 22, highlights the position and number of reported COVID-19 cases, deaths, and recoveries for all affected countries. It has been developed to provide a user-friendly resource for researchers, public health officials, and the public to monitor the outbreak as it unfolds. The dashboard, which was created by Lauren Gardner (an epidemiologist) and her JHU CSSE team (the Center for Systems Science and Engineering (CSSE) at Johns Hopkins University (JHU)), went viral with hundreds of news articles and social media shares. This strong response to the JHU CSSE and other dashboards signifies individuals’ willingness to monitor health threats. Anyone with Internet access can gain a vast amount of knowledge about COVID-19 in just a few clicks (Figure 2)
Time-series
A time-series is a set of observations that are uniformly distributed over time or over a certain other metameter. Data on the time-series are created naturally when a population or other phenomenon is monitored over time. A major goal in public health and biomedical science is to understand how explanatory variables affect an outcome over time. Experience with the use of time-series in monitoring population health during outbreaks of infectious diseases, such as SARS, Ebola, and seasonal influenza, has been demonstrated in various studies (16-21). The software reviewed in this study shows that time-series can be used for various purposes to control the COVID-19 disease. In “nytimes/covid-19-data,” New York Times data are collected from state and local governments, while health ministries are working to fully monitor the ongoing outbreak (Figure 3). Data are used for mapping and tracking reports of outbreaks. Such data will be made available to the public in response to requests from researchers, scientists, and government officials who wish to have access to the data to better understand the outbreak.
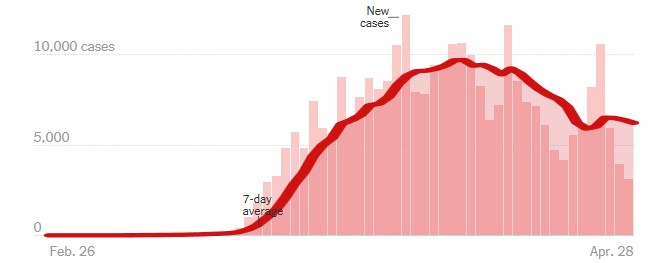
Figure 3. New reported cases by day in New York
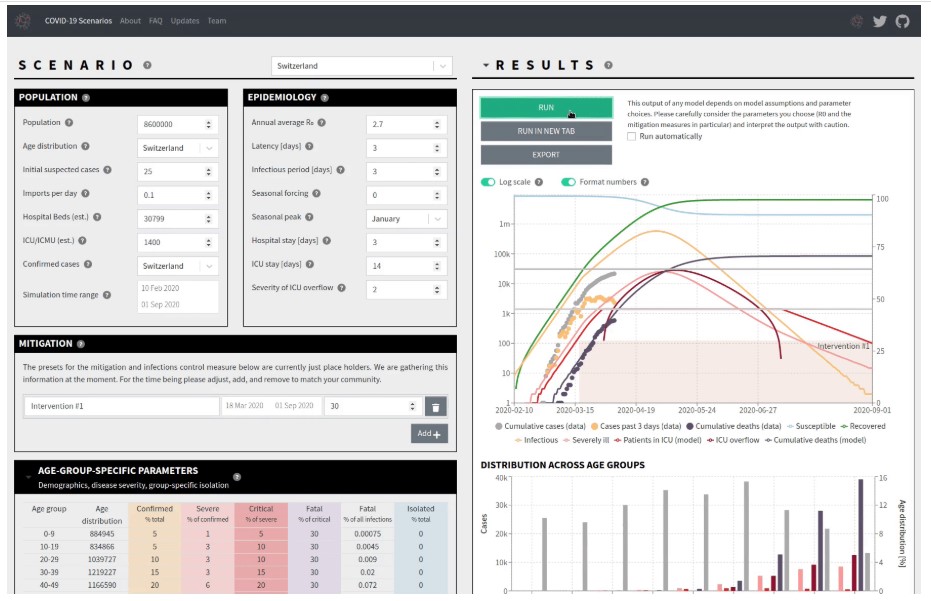
Figure 4. COVID-19 model outbreak trajectories and hospital demand
Artificial Intelligence
As a non-invasive imaging technique, computed tomography (CT) can detect characteristic manifestations in the COVID-19-associated lung and is recommended as the primary evidence for clinically diagnosed cases in this epidemic in Hubei, China. The software utilized in this study used artificial intelligence techniques and tomography images to detect COVID-19 (22, 23). Artificial intelligence refers to any machine that exhibits human mind-related characteristics, such as thinking and problem-solving (24). In computer science, different branches of artificial intelligence are used, some of which include machine learning, neural networks, machine vision, expert system, and genetic algorithm (25). The “ieee8023/covid-chestxray-dataset” developers want to improve triage prognoses and control COVID-19 patient treatment. It would give physicians an advantage and allow them to behave with greater trust when waiting for a radiologist’s report by having a digital second opinion to validate their evaluation of a patient’s condition. Such instruments can also include objective ratings that can be considered and used in studies. In another project, “lindawangg/COVID-Net,” the University of Waterloo has developed a deep convolutional neural network designed to detect COVID-19 cases from chest X-ray images, which are open-source and available to the general public. COVID-Net makes predictions using a method of interpretation to gain greater insight into the crucial factors associated with COVID-19 cases, which can help clinicians enhance screening, as well as increase trust and clarity by using COVID-Net for accelerated computer-aided screening (26).
Epidemiological approaches
Epidemiology is the study of the distribution and scale of disease-related problems in human populations. In particular, it deals with the detection of etiological factors in disease pathogenesis and the collection of important data for the management, assessment, and preparation of disease prevention, control, and treatment services (27). In epidemiological studies, approaches such as simulation models, distribution maps, mortality estimates, forecasts, etc. are used (28, 29). The “neherlab/covid19_scenarios” project simulates a COVID-19 outbreak. The primary aim of the project is to analyze in the near future complexities of COVID-19 cases and the resulting strain on the healthcare system. The outbreak is affected by interventions to monitor infection, such as closures of schools, lockdowns, etc. By changing the mitigation parameters, the impact of these steps can be integrated into the simulation (Figure 4). Also, the numbers of deaths and infections and the effects of non-pharmaceutical treatments are documented in the “ImperialCollegeLondon/covid19model” project, COVID-19 modeling.
Web Service
A web service is a set of open protocols and standards that are commonly used to share data between applications or systems. In healthcare, the web services model offers a perfect platform to solve challenging interoperability issues. Web services are designed to wrap and display existing resources, and also provide interoperability between different applications (30). Web services can expand healthcare enterprises through the delivery of their own services to others (31). They can also prolong the life of existing applications by improving the accessibility of previously proprietary functions as web services (32). Almost any web service is an Application Programming Interface (API). API is a software interface allowing two programs to communicate without any user interaction (33). Regarding the reviewed software, the “BlankerL/DXY-COVID-19-Crawler” provides a completely free API of COVID-19 information. The deployed crawler will crawl the data every minute, store it in MongoDB, and save all updates of historic data. Backtracking the disease may be beneficial in the future. Other projects provide services such as a list of COVID-19-related tweets, running list of events, sharing computable files with data, parameter estimates, and metadata.
Both SourceForge applications display a dataset of global total COVID-19 cases (Figure 5).
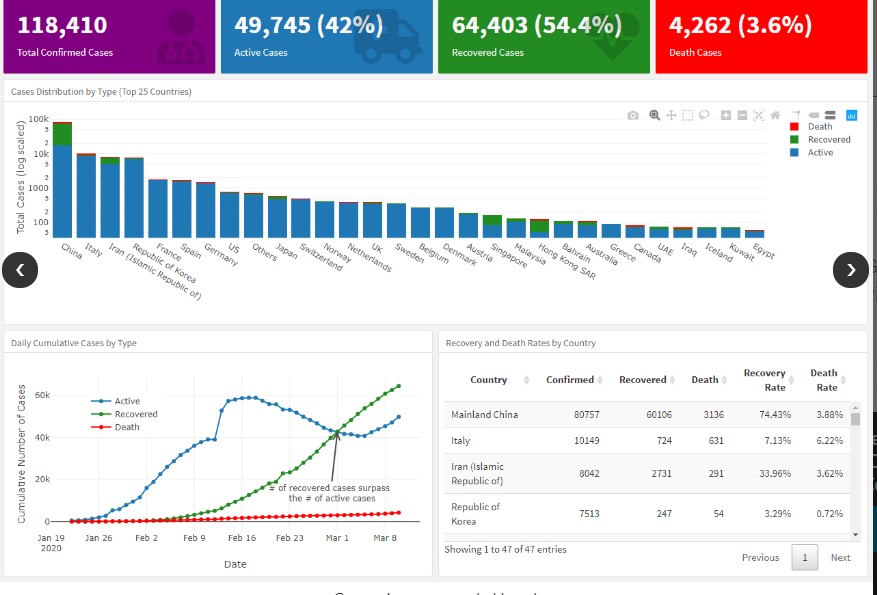
Figure 5. The screenshot of “https://sourceforge.net/projects/coronavirus.mirror/”
Conclusion
During previous epidemics (Ebola and SARS), open-source software helped combat one of the most deadly pandemics in recent days. Using such software will save a great deal of time and money, and it can be useful for global organizations. Our results were limited to new repositories. Older projects related to the long-term support condition customized to COVID-19, such as Ushahidi, were not discussed in the current paper, even though they focused on similar topics. Previously learned lessons from FOSS have shown that the explained projects would play important roles in future epidemics by forking and joining in new projects, Which cover specific events and disasters
Acknowledgements
We would like to express our gratitude to the sanamsahand.com for sharing their pearls of wisdom with us during the course of this research.
Ethical considerations
Ethical issues (Including plagiarism, informed consent, misconduct, data fabrication and/or falsification, double publication and/or submission, redundancy, etc.) have been completely observed by the authors.
Funding and support
This research resulted from an independent research without receiving any financial support.
Conflicts of Interest
Authors declared no conflict of interests.
Received: 2020/05/27 | Accepted: 2020/09/24 | Published: 2021/01/3
| Rights and permissions | |
 |
This work is licensed under a Creative Commons Attribution-NonCommercial 4.0 International License. |
Copyright Policy
