


BibTeX | RIS | EndNote | Medlars | ProCite | Reference Manager | RefWorks
Send citation to:
URL: http://journal.zums.ac.ir/article-1-6503-en.html


 , Mohammad Reza Mohammadi 2, Mohammad Ali Vakili3 , Asieh Sadat Baniaghil4 , Maryam Ghelichli5 , Mohammad Javad Najafi6 , Atousa Mortazavi Milani6 , Amir Hossein Ghadirian6 , Fatemeh Shahrokhi6 , Hasan Khorshah7 , Sepide Sadat Hosseini8
2- Dept. of Neurosurgery, School of Medicine, 5Azar Hospital, Golestan University of Medical Sciences, Gorgan, Iran ,
3- Dept. of Biostatistics and Epidemiology, School of Medicine, Golestan University of Medical Sciences, Gorgan, Iran
4- Dept. of Midwifery, School of Nursing and Midwifery, Golestan University of Medical Sciences, Gorgan, Iran
5- Dept. of Oral and Maxillofacial Pathology, School of Dentistry, Golestan University of Medical Sciences, Gorgan, Iran
6- School of Medicine, 5Azar Hospital, Golestan University of Medical Sciences, Gorgan, Iran
7- Dept.of Statistics, 5Azar Hospital, Golestan University of Medical Sciences, Gorgan, Iran
8- Dept.of Education, 5Azar Hospital, Golestan University of Medical Sciences, Gorgan, Iran
✅ Based on this study, hypertension as an underlying disease was significantly related to Highly Suggestive CT scans. No relation was found between cardiomegaly and death under 48 hours. Our findings Showed Ground Glass Opacity (GGO) in 192 (96%), consolidation in 88 (44%), crazy paving in 30 (15%), cardiomegaly in 30 (15%), and pleural effusion in 53 (26.5%) cases.
December 2019 was the beginning point in time of a very contagious viral disease (–entitled COVID-19 by WHO) in Wuhan, China. An infection that causes acute lower pulmonary tract involvement leading to superimposed septicity. There are many cases with subtle clinical symptoms and milder manifestations but can spread via airborne droplets to others and eventually kill them (1, 2). After the COVID-19 outbreak declaration in Golestan-Iran with a population near 1900000, onJanuary 20, 2020, many patients were referred to the Emergency Departments of 22 hospitals in Golestan Province, Iran.
Unfortunately, some were in bad condition and died with the consequences of acute viral respiratory syndrome. Because of the limitation of access to rRT-PCR kits) due to sanctions, clinical diagnosis was made as per WHO and Ministry of Health guidelines (2).
All cases in this study underwent CT scans, and some had rRT-PCR documents and other paraclinical data. PCR samples were gathered and sent to the Virology Department of Golestan University of Medical Sciences (GOUMS). We collected all chest CT scans of 200 cases diagnosed as COVID-19 who had died in 22 hospitals of Golestan Province and stored them in a separate PACS system. All CT scans were stored in a specific PACS system. A radiologist reported all scans regardless of their initial reports for confirming the diagnosis and transferring data to the checklist provided previously. All scans were reported by a second radiologist again for confirming the diagnosis. Performing CT scans as a valid test even before RT-PCR beccomes positive is time-saving and necessary for admission and starting medical care (3, 4).
This study is derived from a research study (Recording Mortality COVID-19 in Golestan-Iran) approved by the deputy Research of GOUMS and the Medical Ethics Committee (Code: IR.GOUMS.REC.1398.390). A cross-sectional study was carried out on 200 cases who died with COVID-19 acute respiratory syndrome in Golestan (North of Iran). All cases had undergone lung CT scans performed through the standard technique with 3 mm thickness and without a gap in supine and no contrast use. Underlying diseases and medical history were obtained from hospital records HIS (Hospital Information System), and PACS (Picture Archiving and Communication System). Statistical evaluation was made using descriptive analysis and the Chi-Square test. The data analysis was performed using SPSS version 16 (SPSS Inc., IL, USA). The significance level was less than 0.05.
Our cases had mean and standard deviation (SD) age of 64.5±13.57 years, and median of 65, (minimum age 25, maximum 94). After admission 23.6% died before 48 hours, 51.5%in 3-7 days, and 24.9% after 7 days.
In our study 52.5% of the cases were male, and 47.5% female; the mean age was 64.5± 13.57 years. No difference was observed between those who were under 70 years of age and those who were over 70. 23.6% of cases died in the first 48 hours after admission, which could be due to advanced disease or late reference.
Acute symptoms of cases referred to Emergency room were dyspnea (38%), fever (15%), dry cough (13%), myalgia (9%), nausea and vomiting (3.5%), runny nose (1%). Initial symptoms are presened in Table 1.
Table 1. Initial Symptoms
| Male | Female | Total | |||||
| Count | % | Count | % | Count | % | ||
| Runny Nose | Yes | 2 | 1.90 | 0 | 0.00 | 2 | 1.00 |
| No | 103 | 98.10 | 95 | 100.00 | 198 | 99.00 | |
| Body Pain | Yes | 10 | 9.52 | 8 | 8.42 | 18 | 9.00 |
| No | 95 | 90.48 | 87 | 91.58 | 182 | 91.00 | |
| Cough | Yes | 12 | 11.43 | 14 | 14.74 | 26 | 13.00 |
| No | 93 | 88.57 | 81 | 85.26 | 174 | 87.00 | |
| Dyspnea | Yes | 36 | 34.29 | 41 | 43.16 | 77 | 38.50 |
| No | 69 | 65.71 | 54 | 56.84 | 123 | 61.50 | |
| Nausea and Vomiting | Yes | 4 | 3.81 | 3 | 3.16 | 7 | 3.50 |
| No | 101 | 96.19 | 92 | 96.84 | 193 | 96.50 | |
| Diarrhea | Yes | 0 | 0.00 | 0 | 0.00 | 0 | 0.00 |
| No | 105 | 100.00 | 95 | 100.00 | 200 | 100.00 | |
| Hemoptysis | Yes | 0 | 0.00 | 0 | 0.00 | 0 | 0.00 |
| No | 105 | 100.00 | 95 | 100.00 | 200 | 100.00 | |
| Fever | Yes | 15 | 14.29 | 15 | 15.79 | 30 | 15.00 |
| No | 90 | 85.71 | 80 | 84.21 | 170 | 85.00 | |
| Sore Throat | Yes | 0 | 0.00 | 0 | 0.00 | 0 | 0.00 |
| No | 105 | 100.00 | 95 | 100.00 | 200 | 100.00 | |
| Other | No | 100 | 95.24 | 90 | 94.74 | 190 | 95.00 |
| Yes | 5 | 4.76 | 5 | 5.26 | 10 | 5.00 | |
One hundred cases had no specific symptoms, 25.5%had only one symptom, 19.5% had two, 4.5% had three and 0.5% had four of above symptoms. We had no gastrointestinal and hemoptysis complaints.
Severity of involvement of lung lobes was scored 0-4, (no lobar involvement=0, <25%=1, 25%-50%=2, 50% -75%=3, >75%=4). Right lower lobe (RLL) was involved in 69%, Left lower lobe (LLL) in 64%, left upper lobe (LUL) in 50%,and Right upper lobe (RUL)in 47.5%. 13.5% of cases had no Right middle lobe (RML) involvement. (Table 2).
Table 2. The severity of Lobar Involvement
| Male | Female | Total | |||||
| Count | % | Count | % | Count | % | ||
| RUL | Score 0 | 6 | 5.71 | 6 | 6.32 | 12 | 6.00 |
| Score 1&2 | 41 | 39.05 | 52 | 54.74 | 93 | 46.50 | |
| Score 3&4 | 58 | 55.24 | 37 | 38.95 | 95 | 47.50 | |
| RML | Score 0 | 14 | 13.33 | 13 | 13.68 | 27 | 13.50 |
| Score 1&2 | 56 | 53.33 | 60 | 63.16 | 116 | 58.00 | |
| Score 3&4 | 35 | 33.33 | 22 | 23.16 | 57 | 28.50 | |
| RLL | Score 0 | 4 | 3.81 | 4 | 4.21 | 8 | 4.00 |
| Score 1&2 | 22 | 20.95 | 32 | 33.68 | 54 | 27.00 | |
| Score 3&4 | 79 | 75.24 | 59 | 62.11 | 138 | 69.00 | |
| LUL | Score 0 | 5 | 4.76 | 5 | 5.26 | 10 | 5.00 |
| Score 1&2 | 43 | 40.95 | 47 | 49.47 | 90 | 45.00 | |
| Score 3&4 | 57 | 54.29 | 43 | 45.26 | 100 | 50.00 | |
| LLL | Score 0 | 2 | 1.90 | 4 | 4.21 | 6 | 3.00 |
| Score 1&2 | 31 | 29.52 | 35 | 36.84 | 66 | 33.00 | |
| Score 3&4 | 72 | 68.57 | 56 | 58.95 | 128 | 64.00 | |
RUL: Right upper lobe
RML; Right middle lobe
RLL: Right lower lobe
LUL: left upper lobe
LLL: Left lower lobe.
Underlying diseases found were hypertension in 45 (22.5%), history of heart problem in 39 (18.5%), diabetes in 30 (15%), renal disease or on dialysis in 10 (5%), malignancy or on chemotherapy in 8(4%), lung disease, asthma and COPD in 6 (3%), nervous disease and seizure in 5 (2.8%), Body Mass Index (BMI) > 40 in1 (0.5%), no liver disease, other diseases in 10(5%) cases. 110 (55%) Patients had no underlying disease ,and 90(45%) had at least one underlying disease.
Underlying diseases are presented in Table 3.
| Male | Female | Total | |||||
| Count | % | Count | % | Count | % | ||
| History of hypertension | No | 83 | 79.05 | 72 | 75.79 | 155 | 77.50 |
| Yes | 22 | 20.95 | 23 | 24.21 | 45 | 22.50 | |
| History of heart disease | No | 90 | 85.71 | 73 | 76.84 | 163 | 81.50 |
| Yes | 15 | 14.29 | 22 | 23.16 | 37 | 18.50 | |
| History of diabetes | No | 97 | 92.38 | 73 | 76.84 | 170 | 85.00 |
| Yes | 8 | 7.62 | 22 | 23.16 | 30 | 15.00 | |
| History of kidney disease or dialysis | No | 99 | 94.29 | 91 | 95.79 | 190 | 95.00 |
| Yes | 6 | 5.71 | 4 | 4.21 | 10 | 5.00 | |
| History of Malignancy or Chemotherapy | No | 102 | 97.14 | 90 | 94.74 | 192 | 96.00 |
| Yes | 3 | 2.86 | 5 | 5.26 | 8 | 4.00 | |
| History of lung disease , asthma ,or COPD | No | 104 | 99.05 | 90 | 94.74 | 194 | 97.00 |
| Yes | 1 | 0.95 | 5 | 5.26 | 6 | 3.00 | |
| History of nervous disease/seizure | No | 102 | 97.14 | 93 | 97.89 | 195 | 97.50 |
| Yes | 3 | 2.86 | 2 | 2.11 | 5 | 2.50 | |
| BMI > 40 | No | 105 | 100.00 | 94 | 98.95 | 199 | 99.50 |
| Yes | 0 | 0.00 | 1 | 1.05 | 1 | 0.50 | |
| History of liver disease | No | 105 | 100.00 | 95 | 100.00 | 200 | 100.00 |
| Yes | 0 | 0.00 | 0 | 0.00 | 0 | 0.00 | |
| Other | No | 100 | 95.24 | 90 | 94.74 | 190 | 95.00 |
| Yes | 5 | 4.76 | 5 | 5.26 | 10 | 5.00 | |
BMI: Body Mass Index.
All CT scans had been collected from 22 hospitals in a separate database PACS; Reports were transferred to the checklist. CT scans were categorized as Highly Suggestive in 171 (85%), Indeterminate in 20 (10%), and Inconsistent in 9 (4.5%) cases. (Figure 1).
Lungs were involved bilaterally in 196 (98%), and unilaterally in 4 (2%) cases. The other results were as follows: Ground Glass Opacity (GGO) 192 (96%), consolidation 88 (44%), crazy paving 30 (15%), cardiomegaly 30 (15%), pleural effusion 53 (26.5%), pericardial effusion 7 (3.5%), significant lymphadenopathy (LAP) (>1 cm diameter) 7 (3.5%), bronchiectasis 7 (3.5%), emphysema 5 (2.5%), intrathoracic mass 5 (2.5%), fibrosis 4 (2%), cavity formation 3 (1.5%), and pneumothorax 3 (1.5%). No reverse halo was seen. GGO and consolidation together was seen in 83 (41.5%) cases. (Table 4)
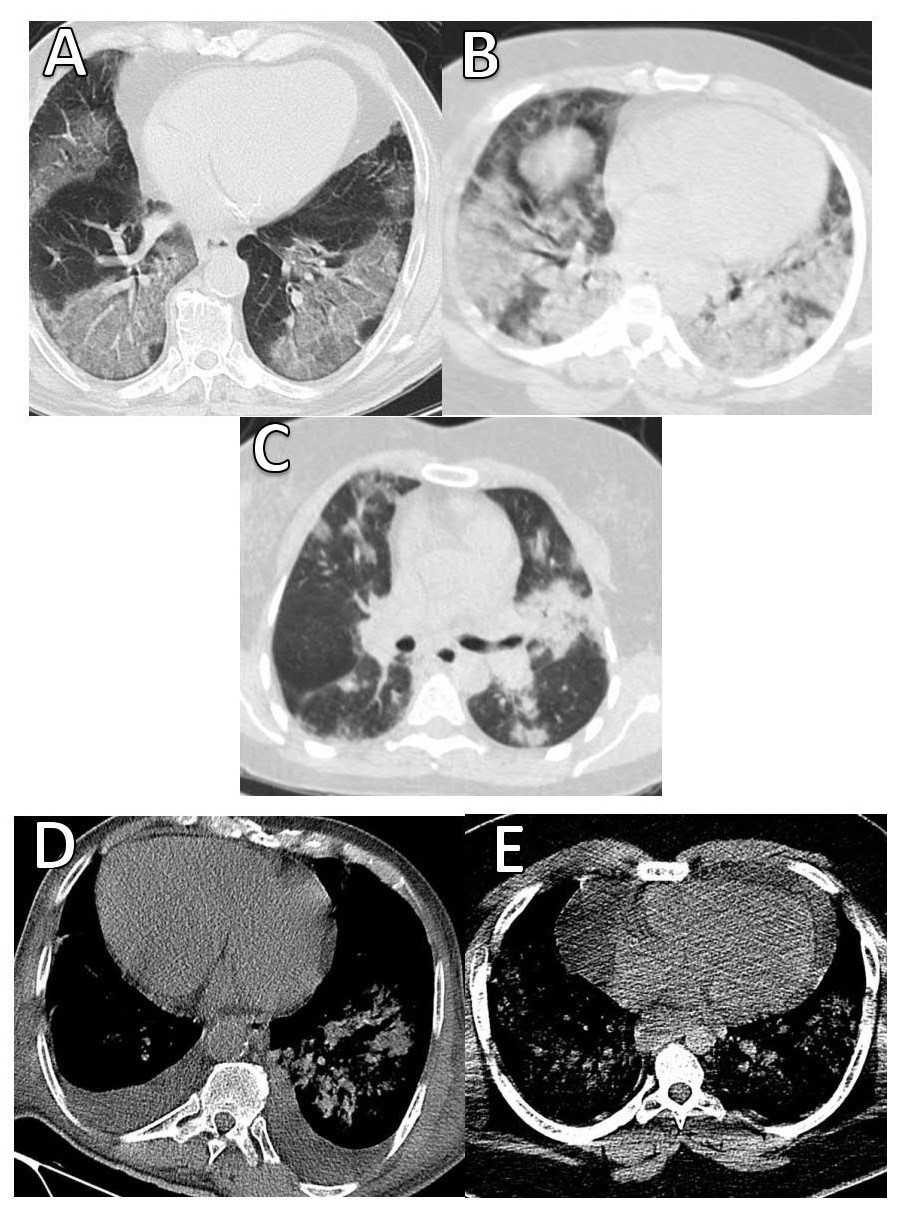
Figure 1. Chest radiography and CT imaging:
A) Multiple bilateral ground-glass densities. B) Bilateral patchy consolidations. C) Patchy consolidations on the left lung and ground glass densities on the right side. D) Cardiomegaly and pleural effusion. E) Cardiomegaly and pericardial effusion associated with pulmonary infiltrations.
Table 4. CT scan findings
| Count | % | Count | % | Count | % | ||
| CT Finding | Highly Suggestive | 90 | 85.71 | 81 | 85.26 | 171 | 85.50 |
| Indeterminate | 10 | 9.52 | 10 | 10.53 | 20 | 10.00 | |
| Inconsistent | 5 | 4.76 | 4 | 4.21 | 9 | 4.50 | |
| Lung involvement | Unilateral | 2 | 1.90 | 2 | 2.11 | 4 | 2.00 |
| Bilateral | 103 | 98.10 | 93 | 97.89 | 196 | 98.00 | |
| GGO | Yes | 101 | 96.19 | 91 | 95.79 | 192 | 96.00 |
| No | 4 | 3.81 | 4 | 4.21 | 8 | 4.00 | |
| Consolidation | Yes | 46 | 43.81 | 42 | 44.21 | 88 | 44.00 |
| No | 59 | 56.19 | 53 | 55.79 | 112 | 56.00 | |
| Pleural effusion | Yes | 25 | 23.81 | 28 | 29.47 | 53 | 26.50 |
| No | 80 | 76.19 | 67 | 70.53 | 147 | 73.50 | |
| Crazy Paving | Yes | 18 | 17.14 | 12 | 12.63 | 30 | 15.00 |
| No | 87 | 82.86 | 83 | 87.37 | 170 | 85.00 | |
| Cardiomegaly | Yes | 14 | 13.33 | 17 | 17.89 | 31 | 15.50 |
| No | 91 | 86.67 | 78 | 82.11 | 169 | 84.50 | |
| Pericardial effusion | Yes | 1 | 0.95 | 6 | 6.32 | 7 | 3.50 |
| No | 104 | 99.05 | 89 | 93.68 | 193 | 96.50 | |
| LAP | Yes | 3 | 2.86 | 4 | 4.21 | 7 | 3.50 |
| No | 102 | 97.14 | 91 | 95.79 | 193 | 96.50 | |
| Bronchiectasis | Yes | 1 | 0.95 | 6 | 6.32 | 7 | 3.50 |
| No | 104 | 99.05 | 89 | 93.68 | 193 | 96.50 | |
| Emphysema | Yes | 3 | 2.86 | 2 | 2.11 | 5 | 2.50 |
| No | 102 | 97.14 | 93 | 97.89 | 195 | 97.50 | |
| Intra Thoracic Mass | Yes | 2 | 1.90 | 3 | 3.16 | 5 | 2.50 |
| No | 103 | 98.10 | 92 | 96.84 | 195 | 97.50 | |
| Fibrosis | Yes | 1 | 0.95 | 3 | 3.16 | 4 | 2.00 |
| No | 104 | 99.05 | 92 | 96.84 | 196 | 98.00 | |
| Cavity formation | Yes | 2 | 1.90 | 1 | 1.05 | 3 | 1.50 |
| No | 103 | 98.10 | 94 | 98.95 | 197 | 98.50 | |
| Pneumothorax | Yes | 3 | 2.86 | 0 | 0.00 | 3 | 1.50 |
| No | 102 | 97.14 | 95 | 100.00 | 197 | 98.50 | |
| Reverse halo | Yes | 0 | 0.00 | 0 | 0.00 | 0 | 0.00 |
| No | 105 | 100.00 | 95 | 100.00 | 200 | 100.00 | |
Discussion
After the statement of the COVID-19 pandemic by the World Health Organization (WHO) on January 30, 2020, many people died from this new unseen disaster all over the world. In an unequal combat, on one side therewere the organizations responsible for saving the lives of humans, and on the other side humanity suffered from disease and its complications with no adequate information (2).
Based on our results, comorbid diseases were hypertension in 45 (22.5%), heart problems in 37 (18.5%), diabetes in 30 (15%), renal diseases in 10 (5%), malignancy or on chemotherapy 8 (4%) cases. Similar to to our results, Shi et al., reported accompanying diseases as hypertension in 12 (15%), diabetes in 10 (12%), chronic pulmonary disease in 9 (11%), and cardiovascular disease in 8 (10%) cases (5).
Prominent symptoms with which patients referred to ER were dyspnea 77 (38.5%), fever 30 (15%), and dry cough 26 (13%). Half of the patients (50%) had no significant complaints, but deterioration occurred later.. These symptoms also were observed in the results of Zhou et al., (4), Shi et al., (5), Han et al., (6), Pan et al., (7), Chung et al., (8), and Li et al., (9).
In the first 48 hours after admission 23.6% of the cases died, which could be due to advanced disease or late reference because of low knowledge of the novel disease (5, 6).
The majority (98%) of the cases had involved pulmonary tissue bilaterally, GGO (96%), consolidation (44%), crazy paving (15%), and cardiomegaly (15.5%) which were our prominent findings. InWei et al., report CT showed rapidly growing ground-glass opacities and progressing peripheral consolidations in both lungs (10).
Fluid leakage to alveoli space leads to non-complete filling of spaces, sparing bronchial tree, seen in X-rays, and CT scan as white areas (GGO). Continuing the process leads to the hardening of alveolar walls and disability in expanding enough, seen as consolidation. Severe changes in pulmonary tissue media by inflammatory cytokines predispose injured tissue to super-imposed infections. In most reported studies GGO+ consolidation is the best hallmark for treatment initiation and following the progression of medical care (9-11). In other studies, the sensitivity of pulmonary CT scans was evaluated as 97% (12- 14).
Cardiomegaly in 31 (15.5%) and Pericardial effusion in 7 (3.5%) cases were also seen. In this group (cardiomegaly and pericardial) hypertension in 35 (17.5%), heart disease in 31.9%, and DM in 22.9% of the cases were reported as the underlying diseases. Patients with hypertension and heart disease do not seem to be more prone to show cardiovascular symptoms. There was no significant relevance between these groups and death under 48 hours (11).
There may be earlyonset or nondiagnosed cardiac problems exacerbated by a virus attack. Viremia causes high temperature, cytokine storm, and inflammatory response of the immune system that may impose more pressure on the myocardium. On the other hand, increasing demand for oxygen will not be responded adequately by disturbed alveolar O2 change. Viral myocarditis has been reported with other viruses, which is also seen in COVID-19 (15).
A comparison between patients with HTN in a highly suggestive group and an indeterminate group showed no significant relation. Diabetes had no significant association.
We had only 7(3.5%) cases with more than 10 mm diameter lymph nodes. When LAP is seen it can be the sign of advanced disease and superimposed bacterial infection. Yet, LAP is rarely seen in most reports.
The tendency of viruses to invade basilar lobes and posterior parts of lungs was seen in our study, with RLL suffering higher than others (69%) followed by LLL (64%). The right middle lobe has the lowest rate of involvement (28%) in the scores 3and 4. RML was not involved in 13.5%. These findings could be due to the gravity effect, resting position, and anatomical location of bronchi (7, 10, 11).
Conclusion
Acknowledgements
The authors would like to acknowledge Dr. Alijan Tabarraei, Ph.D., Professor of Medical Virology, and Golestan University of Medical Sciences for their cooperation and giving useful consultations to our team. And also, we thank Mohsen Mansouri, M.Sc., and Mohammad Gholamrezaei, M.Sc., Statistics and Information Technology Management Unit of Golestan University of Medical Sciences, for making PACS system data available for the current study.
Ethical considerations
Ethical issues (Including plagiarism, informed consent, misconduct, data fabrication and/or falsification, double publication and/or submission, redundancy, etc.) have been completely observed by the authors. This study is derived from a research study (Recording Mortality COVID-19 in Golestan-Iran) approved by the deputy Research of GOUMS and the Medical Ethics Committee (Code: IR.GOUMS.REC.1398.390).
Conflicts of Interest
The authors declare no conflict of interest.
Received: 2021/04/13 | Accepted: 2021/10/25 | Published: 2022/04/1
| Rights and permissions | |
 |
This work is licensed under a Creative Commons Attribution-NonCommercial 4.0 International License. |
Copyright Policy
