


BibTeX | RIS | EndNote | Medlars | ProCite | Reference Manager | RefWorks
Send citation to:
URL: http://journal.zums.ac.ir/article-1-6137-en.html


2- Dept. of Exercise Physiology, University of Kurdistan, Sanandaj, Iran
3- Dept. of Physical Education and Sport Sciences, Shahid Bahonar University of Kerman, Kerman, Iran.
✅ These findings suggest that consuming caffeine can prevent HFD-induced liver and adipose tissue (AT) inflammation.
Adipose tissue (AT) as an endocrine organ plays significant roles in regulating many diseases via secreting adipocytokines, such as interleukin 10 (Il-10) and tumor necrosis factor α (Tnf-α) (1). Tnf-αis secreted mainly by M1 macrophages in AT during obesity (1). Free fatty acids (FFA), released by hypertrophied adipocytes, bind with toll-like receptors (Tlrs) on macrophages’ surfaces and induce macrophages to release Tnf-α (2).
Tlr4 is located on the outer membrane of immune cells and recognizes lipopolysaccharide (LPS) on the surface of bacteria, which is responsible for host defense responses through two signaling pathways, including myeloid differentiation factor 88 (MyD88) and Tir domain-containing adaptor-inducing interferon-β (Tirf) signaling cascades, leading to the activation of transcription factors, such as nuclear factor kappa B (Nf-κb) and activator protein-1 (AP-1) (3). Tlr4-induced activation of these transcription factors leads to upregulation of the transcription of inflammatory genes, ensuring the production of inflammatory cytokines (2).
Obesity-induced insulin resistance is part of the activation of Tlr4-Nf-κbsignaling through FFA (2), which is a protein adapted to fetuin-A (FetA) (4). FetA is an important hepatokine glycoprotein secreted into the bloodstream, which is described as a potent inhibitor of insulin-dependent tyrosine kinase in myocytes and liver cells and induces insulin resistance (5). It has been shown that FetA levels of AT in rats with a high-fat diet (HFD) are remarkably increased and contribute to macrophage migration and polarization )M2 to M1( (6). Paul et al. demonstrated that in mice with HFD, FetA played a crucial role in the activation of FFA-induced Tlr4 in adipocytes and thus in insulin resistance (4).
The effects of caffeine on the immune system have been investigated. Although most studies have shown that caffeine reduces the production of cytokines during inflammation and tissue damage (7), other studies have indicated that caffeine worsens or does not play an important role in inflammation (8). In this regard, Yamauchi and colleagues (2010) showed that caffeine ingestion decreases messenger RNA (mRNA) levels of monocyte chemotactic protein 1 (MCP-1), Tnf-α, and Il-6 in AT (9). It has also been reported that caffeine ingestion decreases mRNA and protein expression of Tnf-αin the alcoholic liver of mice (9). Previous studies revealed that FetA levels were reduced during short-term calorie restriction (10), and curcumin supplement (11) in both human and animal studies. Although evidence has confirmed the anti-inflammatory effect of caffeine (12), its role in the development of FetA induced by Tlr4/Nf-κb signaling has not been investigated.
Previous studies showed that caffeine decreased body fat in rats and reduced pro-inflammatory cytokines Tnf-αand Il-12 by LPS-stimulated monocytes (13). To the best of our knowledge, no study has addressed the effects (mechanism) of caffeine ingestion on regulating the liver and AT inflammation. Thus, we hypothesized that caffeine would inhibit the gene expressions of FetA, Tlr4, and Nf-κb genes in the liver and visceral adipose tissue (VAT) of HFD-induced obesity.
Animal
All animal experiments were conducted by national guidelines and approved by the University of Kurdistan Ethics Committee (IR.UOK.REC.1397.024). A total of 40 male Wistar rats (being 8 weeks old and weighing 180±10 g) were purchased from the Pasteur Institute of Karaj (Iran). The animals were housed in polycarbonate cages (4 in a cage). After 2 weeks of adaptation to the environment, the animals were randomly divided into 4 groups (10 rats in each group): control with a normal diet, HFD, caffeine, and HFD+caffeine groups. The environment temperature was 23±2°C under the conditions of a 12-hour light/dark cycle and humidity of 45%±5%.
Dietary Program
In this experimental study, the rats were exposed to two specific diets for 8 weeks. Normal dietary (ND) components contained 5% fat, 65% carbohydrate, 20.3% protein, 5% fiber, 3.7% salt mixture, and 1% vitamin mixture. In addition, HFD included 46% fat, 24% carbohydrate, 20.3% protein, 5% fiber, 3.7% salt mixture, and 1% vitamin mixture (14). Both diets were purchased from Pars Dam Company, Tehran, Iran. HFD was kept at 4°C until use. An oral supplement of caffeine was purchased from Sigma-Aldrich Co., Ltd. (St Louis, MO, USA) and dissolved in water. Caffeine supplementation was administered to rats once a day (4 PM) with gavage (6 mg/kg of body weight) (15). The rats were weighed weekly at specified times. The animals had free access to water and food.
Tissue Separation
The animals were anesthetized using xylazine (3 to 5 mg/kg of body weight) and ketamine (30 to 50 mg/kg of body weight) (16). For tissue sampling, then, the VAT and liver tissues of 6 rats in each group were taken and used for RNA extraction. The rats were kept fasted with free access to water for 12 hours before dissection; also, at the time of dissection, to prevent the effect of time on the levels of hormones (circadian rhythm), the rats were killed alternately from quaternary groups. After dissection and sampling, the liver and VAT samples were washed with distilled water and placed in deoxyribonuclease (DNase) and ribonuclease (RNase) free microtubes containing liquid of RNA latter, and then they were stored in a refrigerator at -80°C for laboratory work.
RNA Extraction
According to the manufacturer’s instructions, 1 mL of RNX PL-PLUS was added to the sample, centrifuged, and incubated for 5 minutes at room temperature. Also, 0.2 mL of chloroform was added to microtubes and shaken well for 15 seconds; then, the sample was placed on ice at 4°C for 5 minutes. The samples were centrifuged at 12 000 rpm for 15 minutes at 4°C; next, the aqueous phase was transferred to the new microtube, and an equal volume of isopropanol was added, mixed gently, and incubated for 15 minutes on ice. Then, the mixture was centrifuged at 12 000 rpm at 4°C for 15 minutes. Next, the supernatant was removed, and 1 mL of 75% ethanol was added and gently vortexed to dislodge pellets from the microtubule floor and then centrifuged at 7500 rpm for 8 minutes at 4°C. The supernatant was discarded again, and pellets were dried at room temperature; then, the pellets were dissolved in 50 μL of diethylpyrocarbonate (DEPC) and incubated at 55 to 60°C for 10 minutes.
Complementary DNA Synthesis and Quantitative Evaluation by Real-Time Polymerase Chain Reaction
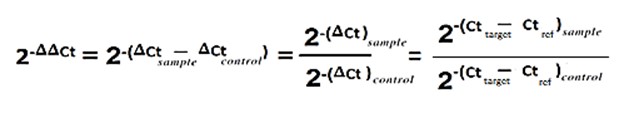
RNA was reverse transcribed into complementary DNA (cDNA) using a Takara cDNA Synthesis kit (Takara Bio, Shiga, Japan). Quantitative real-time polymerase chain reaction (PCR) was used to validate a subset of differentially expressed genes. Gene-specific primers were designed using Primer3 (specifically the primer3_core program) (Table 1). Relative quantitative real-time PCR was performed on a Qiagen thermal cycle using the Amplicon SYBR Green PCR principle according to the manufacturer’s protocol. Each run consisted of 95°C for 15 minutes, followed by 40 cycles of 95°C for 10 seconds, 60°C for 15 seconds, and 72°C for 20 seconds in a real-time qPCR machine.
Table 1. Sequences of primers used for Real-Time Quantitative Polymerase
| Product size(bp) | Length (bp) | Primers (5'à3') | Sequence | Accession Number | Gene Name |
| 114 | 20 | GAC CCG GAA ACA GAG CAT GT | F | 012898.4 | FetA |
| 20 | CCG AGA CCA CAC CTT GAC TT | R | |||
| 129 | 20 | AAC ATG GCA GAC GAT CC | F | 001276711.1 | Nf-κb |
| 22 | AAG GTA TGG GCC ATC TGT TGA C | R | |||
| 143 | 20 | TCA TGC TTT CTC ACG GCC TC | F | 019178.1 | Tlr4 |
| 22 | TAG GAA GTA CCT CTA TGC AGG G | R |
The House Keeping Gene for Normalization and Clarification of Gene Expression Fold Change
Control genes, often referred to as housekeeping genes, are often used to normalize mRNA levels between different samples. This should indicate a stable expression level in different tissues and under different treatments. However, the expression level of these genes may vary in tissues or cells, as well as under certain conditions. Therefore, the selection of household genes is very important for gene expression studies. Ribosomal protein L13A (RpL13a) , is one of the most reliable and stable reference genes in AT (17). The β-actin gene encodes a structural protein of the cytoskeleton and is perhaps the most widely used gene to normalize gene expression experiments (18). We used RpL13a as a reference gene in AT and β-actin in liver tissue.
To calculate the gene expression fold change, we used the Relative expression software tool (REST) and ratio formula.
The genes’ expression fold changes were clarified in the context body.
Statistical Analysis
Data values are expressed as the mean ± SEM. The 1-way analysis of variance (ANOVA) test was applied to clarify significant differences between the groups, and the Tukey post hoc U test was performed. All analyses were conducted using SPSS 24.0 (SPSS Inc., Chicago, Ill., USA) and GraphPad Prism 8.4 (GraphPad Software Inc., San Diego, CA, USA). The statistical significance level was set at P-value≤ 0.05.
The Effects of Caffeine and HFD on Weight Changes
After 8-week experimental periods, although not significantly different, 11.7% weight gain was observed in the HFD group compared to the control group (P=0.411). However, there were significant decreases in average weight gain in the caffeine (-29.75%) and HFD+caffeine (-43.49%) groups compared to the control group (P=0.001 and P=0.001, respectively; see Figure 1).
The final weight of the caffeine and HFD+caffeine groups was decreased by -15.37% and -20.47% compared to the HFD group (P=0.001). In the comparison between HFD+caffeine and caffeine groups, although no significant difference was found, the weight loss of -6.03% was observed (P=0.262; see Figure 1).

Figure 1. The effect of caffeine consumption and HFD on the weight changes of samples.
Data are represented as mean ± SEM.
Abbreviation: HFD, high-fat diet.
*vs Control; #vs HFD; (P<0.05).
The Effect of Caffeine Consumption and HFD on the Expression of FetA Inflammatory Markers in Liver Tissue
No significant differences were found in FetA mRNA of the HFD and caffeine groups compared to the control group (P=0.251, P=0.591). However, FetA gene expression was significantly decreased by 1.75-fold down-regulated in the HFD+caffeine group compared to the control group (P=0.005). In addition, FetA was significantly down-regulated in the HFD+caffeine group compared to the HFD and caffeine groups (1.72-fold ,P=0.003 and 1.62-fold , P=0.003, respectively; see Figure 2).
Figure 2. The effect of caffeine consumption and HFD on the expression of the FetA inflammatory marker in liver tissue.
Data are represented as mean ± SEM.
Abbreviations: FetA, fetuin-A; mRNA, messenger RNA; HFD, high-fat diet.
*vs Control; #vs HFD; ●vs Caffeine; (P<0.05).
The Effect of Caffeine Consumption and HFD on Tlr4 Expression in VAT
No significant differences were found between the groups for Tlr4 gene expression (P>0.05). Surprisingly, however, Tlr4 gene expression was decreased by 1.220-fold down-regulated and 1.166-fold down-regulated and increased by 1.267-fold up-regulated in the HFD (P=0.167), caffeine (P=0.287), and HFD+caffeine (P=0.316) groups compared to the control group, respectively (Figure 3).
The Effect of Caffeine Consumption and HFD on the Expression of the Nf-κb Inflammatory Marker in VAT
The results indicated that after feeding with HFD, the expression of the Nf-κb gene was significantly increased by 3.021-fold up-regulated in the HFD group compared to the control group (P=0.001), and a significant difference was observed between the two groups. A comparison of the mean of caffeine and control groups showed that caffeine consumption increased the expression of the Nf-κb gene by 1.424-fold up-regulated, while the mean difference between the two groups was not significant (P=0.115). The mean HFD+caffeine group was increased by 1.537-fold up-regulated compared to the control group, while the mean difference was not significant (P=0.065; see Figure 4).
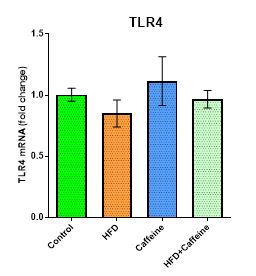
Figure 3. The effect of caffeine consumption and HFD on the expression of the Tlr4 inflammatory marker in VAT.
Data are represented as mean ± SEM; (P>0.05).
Abbreviations: Tlr4, toll-like receptor 4; mRNA, messenger RNA; HFD, high-fat diet.
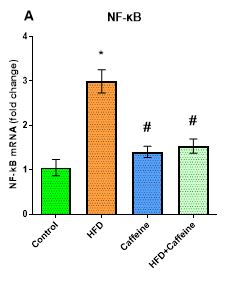
Figure 4. The effect of caffeine consumption and HFD on the expression of the Nf-κbinflammatory marker in VAT.
Data are represented as mean ± SEM.
Abbreviations: Nf-κb, nuclear factor kappa B; HFD, high-fat diet; VAT, visceral adipose tissue; mRNA, messenger RNA.
*vs Control; #vs HFD; (P<0.05).
A comparison of the mean of caffeine and HFD groups demonstrated that the caffeine consumption of 2.118-fold down-regulated decreased the expression of the Nf-κb gene compared to the HFD group, and the mean difference was significant (P=0.001). The differences between the HFD+caffeine and HFD averages showed that the association of caffeine with HFD reduced the gene expression by 1.964-fold down-regulated, and the mean difference was significant (P=0.001; see Figure 4).
Discussion
HFD-induced AT expansion is associated with recruiting inflammatory markers, such as M1 macrophages (19). Nf-κb, as a major regulator of inflammatory responses, plays a crucial role in the physiological and pathological processes of AT inflammation (20). The results of this study showed that HFD consumption increased the gene expression of Nf-κb (Figure 4). This is consistent with a report by Dwivedi et al. (21); this increase can be attributed to the stimulation of Nf-κb inflammatory double pathways (i.e., Tlr4 and NOD-like receptor family, pyrin domain containing 3 (Nlrp3)), particularly the Nlrp3 inflammatory pathway (22). It was also reported that HFD increases adipocyte volume coinciding with reducing the capillary density, leading to AT hypoxia and eventually AT inflammation (19).
Furthermore, the results showed that caffeine ingestion could impede HFD-induced Nf-κb gene expression in VAT (Figure 4). it is well documented that caffeine can inhibit the activation of the Nlrp3 inflammatory pathway by suppressing Mitogen-activated protein kinase (Mapk)/Nf-κb signaling and producing Reactive oxygen species (ROS) associated with the adenosine A2a receptor (A2aR) in LPS-induced inflammatory macrophages (23). According to the unknown caffeine signaling pathway, Nlrp3 inflammatory levels are significantly reduced in LPS-induced inflammatory macrophages after caffeine supplementation (23). Moreover, Mapk/Nf-κb signaling is inhibited by caffeine (24). Suppression of RNA from A2aR leads to an effect on the caffeine-like Nlrp3 pathway (25). In agreement with our findings, the results of Zhao et al. (2019) indicated that caffeine inhibited the phosphorylation of JUN N-terminal kinase (Jnk), extracellular signal-regulated kinase (Erk), and signaling transduction pathway 38 (P38) from LPS. Overall, it has been suggested that caffeine pre-treatment interferes with the inhibition of IL-1β transcription regulation by interfering with Mapk-mediated Nf-κb activity (23).
FetA, as an inflammatory marker, is significantly associated with obesity and AT inflammation, but the exact mechanism is still unclear (26). The finding demonstrated that the gene expression of FetA in the HFD group was decreased by approximately 3% compared to the control group (Figure 2). In this study, we did not measure the amount of energy intake. It was observed that although HFD increased the weight of rats by 4.5%, it did not reach a significant level (Figure 1). This is similar to the study conducted by Lin et al. (27).
Our findings also showed that caffeine supplementation reduced FetA inflammatory gene expression (Figure 2). It is also observed that if caffeine supplementation is used with HFD, the rate of FetA reduction is much higher and significant (Figure 2). In other words, the effectiveness of caffeine is more active in the presence of HFD. Some researchers have suggested that caffeine modulates inflammatory symptoms by stimulating and enhancing adenosine receptor expression and activating intracellular anti-inflammatory pathways (28). The effects of adenosine receptor blocking and inhibition of the phosphodiesterase cyclic adenosine monophosphate (cAMP) degrading enzyme were reported as the possible mechanisms of caffeine consumption in reducing inflammatory factors.
Caffeine increases the concentration of cAMP and decreases the production of cytokines, especially Tnf-α (29). This is carried out by activating protein kinase A and reducing the activation of Nf-κb as a key factor in the expression of proinflammatory factors (30). In support of this, Freudelm et al. reported that caffeine-induced adenosine extracellular receptors and increased adenosine concentrations in body fluids indirectly modulated inflammatory responses (28). The findings of the present study are inconsistent with the results by Vedic et al. (31). They revealed that consumption of caffeinated coffee and caffeine for 8 weeks failed to significantly reduce FetA levels compared to the control group in human participants (31).
Our results showed that caffeine consumption was able to control weight gain in all groups (Figure 1). In accordance with our findings, Dangol et al. (2017) reported that caffeine intake reduced the amount of fat and body fat in rats fed with HFD (32). Thus, it can be assumed that caffeine ingestion, along with HFD, can reduce FetA gene expression partly by reducing the Nf-κb gene as a master of AT inflammation.
The results also revealed that HFD not only failed to increase Tlr4 expression but also reduced the gene expression of Tlr4 (Figure 3). A mechanism behind this result can be related to saturation of fatty acids, such as palmitate through FetA, which acts as a natural ligand for Tlr4 expressed in macrophages (25), and they act as FetA carriers and bind to Tlr4 receptors. Therefore, any change in FetA expression in the liver directly affects the Tlr4 signal pathway (33). As mentioned previously, FetA expression is reduced by HFD; therefore, this reduction is effective in stimulating the Tlr4 signal pathway, and the expression of the Tlr4 gene is affected. In confirmation of these findings, Pal et al. reported that owing to the consumption of palmitate fatty acids compared to LPS, the rate of expression of inflammatory markers and macrophages was decreased (33).
Based on the results of this study, caffeine supplementation was demonstrated to increase Tlr4 expression. In other words, not only did this nutrient not play a role in modulating inflammatory indicators, it significantly increased inflammation (Figure 3). Furthermore, it was observed that in the caffeine group with HFD, the rate of expression of the inflammatory index was lower (Figure 3). This means that HFD has a deterrent effect against the destructive effect of caffeine on inflammation in this signaling pathway. Increased levels of inflammatory indices after caffeine use can be due to the compensatory effects of caffeine on the hypothalamic-pituitary-adrenocortical (HPA) axis and the central nervous system triggering the release of stress hormones (i.e., epinephrine and cortisol) (34). In confirmation of this study, Flecher et al. revealed that caffeine increased the C-reactive protein (CRP) by 1.8- and 2-fold after consuming different amounts of caffeine (2 and 6 mg/BW) (35).
The limitations of this study are that first, we did not analyze the protein levels of Tlr4, Nf-κb, and FetA to clarify the possible mechanism of caffeine ingestion on AT and liver inflammation; second, we were not able to analyze the excrement and measure the daily food intake of each rat to determine the amount of absorbed fat, which can affect the degree of AT and liver inflammation.
Conclusion
HFD can increase the body weight associated with VAT inflammatory gene expression such as Nf-κb. However, it has no effects on Tlr4 and FetA gene expressions. Moreover, caffeine consumption in combination with HFD leads to AT inflammatory gene expression (i.e., Nf-κb, Tlr4, and FetA). These changes were associated with body weight reduction. As a limitation of our study, we did not analyze the protein levels of inflammatory markers; therefore, they need to be addressed in future research. Nevertheless, it can be concluded that caffeine ingestion can reduce the body weight in HFD-induced weight gain, along with the reduction of AT inflammation.
Acknowledgements
The authors thank Ms. Sanaz Mahmazi, and Mr. Mehdi Rahnama, Faculty of Genetic Sciences, Islamic Azad University, Zanjan Branch, and Mr. Nasser Ghanbari, University of Kurdistan, for their contributions to histological studies and the extraction of real-time PCR results.
Conflicts of Interest
The authors declared no conflict of interest.
Received: 2020/07/23 | Accepted: 2020/12/19 | Published: 2021/02/28
| Rights and permissions | |
 |
This work is licensed under a Creative Commons Attribution-NonCommercial 4.0 International License. |
Copyright Policy
