


BibTeX | RIS | EndNote | Medlars | ProCite | Reference Manager | RefWorks
Send citation to:
URL: http://journal.zums.ac.ir/article-1-7072-en.html


 , Seyed Hadi Mousavi *2 , Shaban Alizadeh1 , Mohammad Khani-Eshratabadi1
2- Dept. of Hematology and Blood Transfusion Sciences, School of Allied Medical Sciences, Tehran University of Medical Sciences, Tehran, Iran ,
✅ Our findings indicate that hPMSC-MVs induce Cell death pathways of autophagy and apoptosis in the KG1 cell lines. Additionally, hPMSC-MVs exhibited heightened impactful anti-proliferative and pro-apoptotic outcomes on KG1 cells in vitro.
Acute myeloid leukemia (AML) stands as the prevailing form of acute leukemia among adults, arising in the bone marrow and manifesting abnormal white blood cell count with rapid deterioration. Common treatments, including chemotherapy and bone marrow transplants, often lead to relapse and drug resistance (1). Thus, alternative treatments have become prominent. Out of various therapeutic approaches, mesenchymal stem cells (MSCs) have garnered distinct interest because of their potential advantages in a clinical context. However, MSCs would share similar phenotypes but different functions. Indeed, MSCs of different tissues do not have the same surface markers, which may be due to species diversity, different tissue sources, and different culture conditions (2). MSCs are known as the bone marrow’s stromal cells that support homing, self-renewal, proliferation, hematopoietic stem cell differentiation, and hematopoiesis in the bone marrow (3).
MSCs secret Micro-vesicles (MVs) and growth factors to affect target cells (4). MVs are Cell- to-cell communication implements. According to the cell of origin, MVs differ in composition and expression of the parent cell’s antigens (5). MVs have parent cell’s cytoplasm after the secretion, so they might incorporate cytokines, signaling proteins, miRNAs, and cell-derived mRNAs (6). Studies indicated that MVs derived from MSCs take an antitumor role and activate autophagy/apoptosis cell death pathways in cancer cells (7).
The autophagy mechanism (macro-autophagy, micro-autophagy, and chaperones) is activated within the cell in order to degrade impaired organelles and recycle long-lived proteins (8). For instance, in macro-autophagy, a part of the cell cytoplasm sinks into a specialized vacuole called the autophagic vacuole which eventually merges with lysosome vesicles to destroy the seized material (9). Autophagy contributes to vital procedures, including cell growth, cell survival, and immune responses. Among autophagy-regulating genes, all 30 genes are found in yeast and about 16 of them are identified in humans. Beclin-1 and LC3 genes are known for their core role in autophagy (8). Autophagy, in type II programmed cell death, is due to the accumulation of autophagic vacuoles while apoptosis/type I programmed cell death has other triggers. Uncontrolled autophagy leads to cell death, possibly due to excessive degradation of cellular compounds (10).
Compared to a normal cell, autophagy is altered in a cancer cell. Increased Akt activity in cancer leads to the inhibition of autophagy by mTOR and the uniaxial removal of Beclin-1 inhibits autophagy in many cancers. In addition, the increased expression of Bcl2/Bcl-XL oncogenes and the decreased level of PTEN/p53 tumor suppressor expression in cancerous cells result in autophagy inhibition (11). Moreover, functional defects in apoptosis signaling molecules or the inactivity of the apoptosis pathway are responsible for chemotherapy resistance and ineffective treatment in acute leukemia (12). Therefore, blocking autophagy and apoptosis processes in cancer cells using the potential of micro-vesicles propelled from human placental mesenchymal stem cells (hPMSC-MVs) could offer a novel strategy for enhancing the anti-tumor impact of MSCs.
The impact of hPMSC-MVs on the autophagy pathway of AML cells remains uncertain. Therefore, this research aims to examine the influence of hPMSC-MVs on both the autophagy and apoptosis pathways. Our findings indicate new information on hPMSC-MVs as a prospective candidate in the AML treatment course.
Cell culture
Placental-derived mesenchymal stem cells were provided by the Royan Research Institute. They were cultured in low-glucose Dulbecco’s modified Eagle medium (DMEM; Gibco, CA, USA) and 10% fetal bovine serum (FBS, Merck, Darmstadt, Germany) at 37 °C in humid air containing 5% CO2. The culture medium was replaced every 48 hours. With 1.3 × 10⁵ cells per well, the cells (passage 6) were added to 6-well plates. They were monitored for a period of 6 days, and the culture medium was changed after 72 hours. MVs were extracted from the supernatant after reaching 80% confluence of the adherent cells’ monolayer.
KG1 cell lines were purchased from the Pasteur Institute of Iran and maintained in RPMI medium supplemented with 10% FBS at 37°C in a humidified atmosphere containing 5% CO2. The total cell count was determined using the Trypan blue dye technique. An automatic cell count was conducted by Countess (Invitrogen) revealing that dead cells absorb the dye while live cells stay unstained.
Flow cytometry analysis of hPMSCs
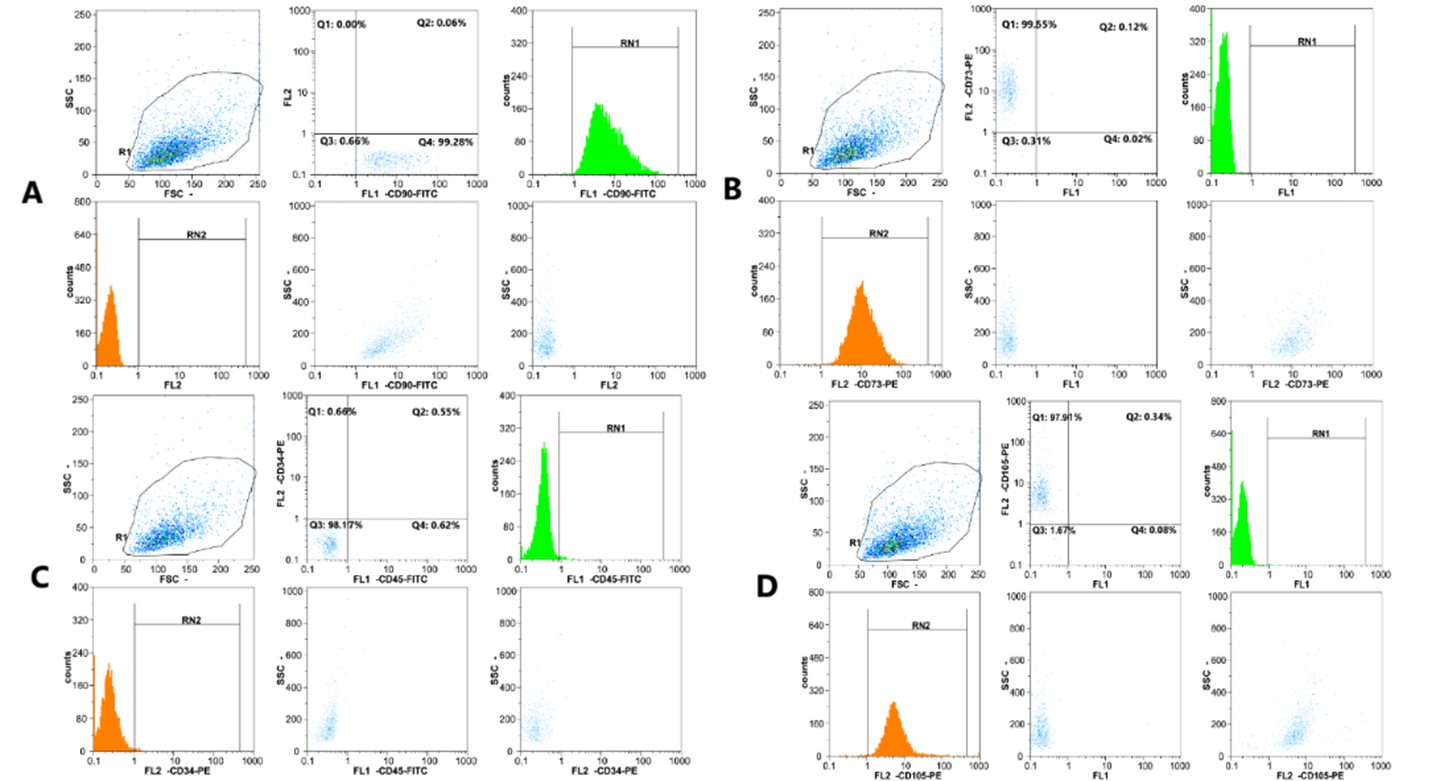
HPMSCS were collected for immune-phenotypic analysis. Phycoerythrin (PE)-labeled anti-CD105, CD90, CD34, CD73, CD45, and IgG isotype control (Dako, Glostrup, Denmark) were used for the staining step of immunophenotyping. The collected cultured hPMSCs were washed and resuspended into 50 μL PBS. 10 μL of each conjugated antibody was applied to the sorted cells. The cells were incubated at 4°C in the dark for 20 minutes. The cells were placed in cold paraformaldehyde (1% concentration) for 30 minutes at 4°C, washed twice with PBS containing FBS (2%), and subjected to flow cytometric analysis (FACS Calibur, BD). Users can locate and isolate a population of interest using the BD FACSCalibur cell sorting option. When processing biohazardous samples, it is especially crucial to sort in a completely contained, aerosol-free environment on the BD FACSCalibur equipment. The sorting procedure is intended to be simple. After gating the desired population, just click "Acquire" to start sorting. A special catcher tube mechanism enters and exits the sample core stream at a rate of roughly 300 times per second to capture targeted cells and direct them to a collection tube or an optional cell concentrator module for additional processing after the sample is acquired and the cells have passed through the laser. For non-specific staining, mouse IgG1 isotype-conjugated control antibodies were utilized.
Isolation of MVs
Using ultracentrifugation, HPMSC-MVs were separated from the MSCs' culture supernatants. Briefly, to isolate the micro-vesicles, mesenchymal cells isolated from the placenta were given passages over several weeks. The uppermost layer was removed and centrifuged at 350 g for 10 minutes at 4 ° C to remove cell debris once the cells in the sixth passage reached 90% density. To eliminate apoptotic bodies, the supernatant was once more taken out and centrifuged at 2000g for 20 minutes. The supernatant soup was then centrifuged in an SW41 swing rotor for 2 hours at 4°C and 100,000 g (Beckman Coulter Optima L-80K ultracentrifuge; Beckman Coulter, Fullerton, CA). In the next step, the microvascular plate was dissolved in 2.5% glutaraldehyde for immunophenotyping and electron microscopy. A Bradford assay kit (Bio-Rad Protein Assay, Bio-Rad, Hercules, CA, USA) was used to calculate the protein concentration.
Characterization of hPMSC-MVs
Transmission Electron Microscopy (TEM) of MVs
Transmission electron microscopy (TEM) (HITACHI, H-7650, Japan) analysis was performed on MVs to determine their size and shape. 2.5% glutaraldehyde in PBS was used to fix the separated MVs for two hours. The MVs were washed, ultracentrifuged, and then, suspended in 100 ml PBS. TEM was used to examine a 20 μL drop of MVs, that had been put to a formvar/carbon-coated grid after it had been negatively stained for 1 minute with 3% aqueous phosphotungstic acid.
Dynamic Light Scattering (DLS) of MVs
According to the previously described technique, the size of the isolated MVs was assessed by dynamic light scattering (DLS) using a Zetasizer Nano ZS DLS device (Malvern Instruments, UK) (13). The scattering intensity distribution (z-average) was considered for the size of MVs, and the size of MVs was then determined through nanoparticle tracking analysis, utilizing a NanoSight LM10 equipment fitted with NTA 2.0 analysis software (NanoSight, Wiltshire, UK). The following concentration was made properly: For size and average measurement, 100 μL of the hPMSC-MVs sample was diluted in 900 μL of PBS in quartz cells. The generated graph was used to determine the size of MVs. Each sample was examined three times.
Measuring the concentration of MVs
The Bradford method was used to determine the concentration of MVs in 10 μL of the sample. For the Bradford assay, the samples of MSC-MVs were thawed, diluted in 90 μL of phosphate buffer saline (PBS, on 1:10) on ice, and prepared in a series of dilutions. The microtubes were filled with the Bradford solution (1000 μL), the sample was added, and the Bradford solution was added again until the sample's color changed. Distilled water was then added until the level reached 20 μL. After mixing for 20 mins, the concentrations were read at 595 nm using a bio-photometer (Pierce, Rockford, IL, USA), and the MV-MSC concentration was quantified up to a 1:2 dilution.
hPMSC-MVs-treated KG1 cells
In each 24-well plate, 1×10⁵ KG1 cells were cultured in the RPMI 1640 medium supplemented with 10% FBS. Next, hPMSC-MVs at concentrations of 25, 50, and 100 μg/mL were added to each well (triplicate). The cells were incubated in an incubator for 24 hours. Free hPMSC-MVs culture of KG1 cells in fresh RPMI-1640 was used as the control.
Detection of ROS
A flow cytometric analysis was performed to determine the presence of ROS utilizing oxidized 2′-7′-dichlorodihydrofluorescein diacetate (DCFH-DA). For 24 hours, hPMSC-MVs were cultivated with KG1 cells at three different doses of 25, 50, and 100 μg/mL. As a control, KG1 cells were grown in a free culture of hPMSC-MVs using fresh RPMI-1640.
After being suspended in 0.3 mL of PBS containing 5 µM DCFH-DA, the cell pellets were incubated at 37 °C in the dark for 20 minutes. The cells were then resuspended in 300 µL of PBS after being centrifuged at 2,000g for 2 minutes. Lastly, a BD FACSCALIBUR flow cytometer (BD Bioscience, San Jose, CA, USA) was used to assess the fluorescence intensity.
Viability evaluation using the Annexin V/PI assay
The impact of hPMSC-MVs on KG1 cells was examined using an apoptotic assay utilizing Annexin V/PI staining. For 24 hours, KG1 cells were grown with hPMSC-MVs at three different concentrations: 25, 50, and 100µg/mL. The control was a free hPMSC-MVs culture of KG1 cells in fresh RPMI-1640. After being incubated for 24 hours, KG1 cells were collected and washed once in PBS, and then, in Annexin V binding buffer. Cells were stained for 10 minutes at room temperature with 3.5 mL of Annexin V-fluorescein isothiocyanate (FITC), and then, counterstained with 3.5 mL of PI. The BECTON DICKINSON FACSCalibur flow cytometer was then used to conduct the analysis.
RNA Extraction and Quantitative Real-Time PCR
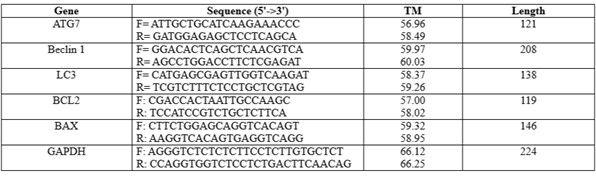
KG1 cells were grown with PMSC-MVs, and total RNA was isolated using Trizol reagent (Invitrogen, Carlsbad, CA, USA) and kept at -80°C. The control was a free hPMSC-MVs culture of KG1 cells in fresh RPMI-1640. With oligo (dT) and Superscript III reverse transcriptase (Invitrogen), one µg of total RNA was reverse-transcribed. The manufacturer's instructions were followed to create the cDNA, which was subsequently stored at -20°C. Quantitative real-time PCR was carried out using SYBR Green PCR Master Mix (Applied Biosystems) in a StepOnePlusTM Real-Time PCR Detection System (ABI) and employing cDNAs as templates and particular oligonucleotides as primers for the human ATG7, LC3, Beclin1, BCL-2, and BAX genes. Target genes' relative expression was determined using the ΔΔCT technique (n=3). Table 1 displays the primer pairs employed for gene amplification.
Table 1. The primers' sequence designed within this investigation is outlined as follows:
Graph Pad Prism 7's (GraphPad, S. Diego, CA, USA) one-way ANOVA and Tukey test were used to compare mean volumes. The mean ± SD values were utilized. The statistical significance was defined as a p-value ˂ 0.05.
Ethics approval and consent to participate
The current research received approval from the Ethics Committee at Tehran University of Medical Sciences. (IR.TUMS.SPH.REC.1399.174).
Surface immunophenotypic markers of hPMSCs were detected by Flow Cytometry. All samples of hPMSCs exhibited favorable expressions of CD105, CD90, and CD73, while they displayed no presence of CD34 and CD45 (Figure 1).
The morphology and size of the isolated MVs were verified by TEM. HPMSC-MVs were diverse lipid bilayer vesicles with a diameter ranging from 100 - 1000 nm. In the case of morphological indications, the cup-shaped or irregular-shaped forms were reported. The Mode of the electron microscopic tissue preparation causes some bigger vesicle morphology alteration in electron transmission microscopy observation. The dimensions of MSC-MVs were determined to be 571.5 nm using the dynamic light scattering (DLS) technique with a nanoparticle analyzer (Figure 2). Also, the density of MSC-MVs was quantified as 114.52 μg/mL by the Bradford method.
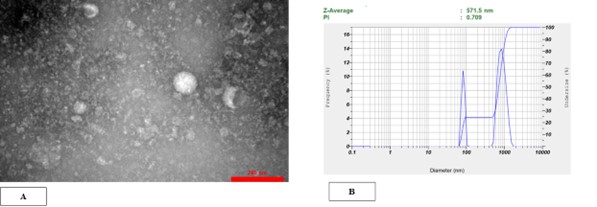
Figure 2. HPMSC-derived microvesicles were successfully isolated by ultracentrifugation. (A) Transmission electron microscopy verified the spherical form and dimensions of individual microvesicles. hPMSC-MVs were heterogeneous lipid bi-layer vesicles with a diameter varying from 100 to 1000 nm. (B) DLS outcomes pertaining to the size dispersion of MVs. The results acquired using the HORIBA SZ-100 device set the size range of hPMSC-MVs at 564.2 nm.
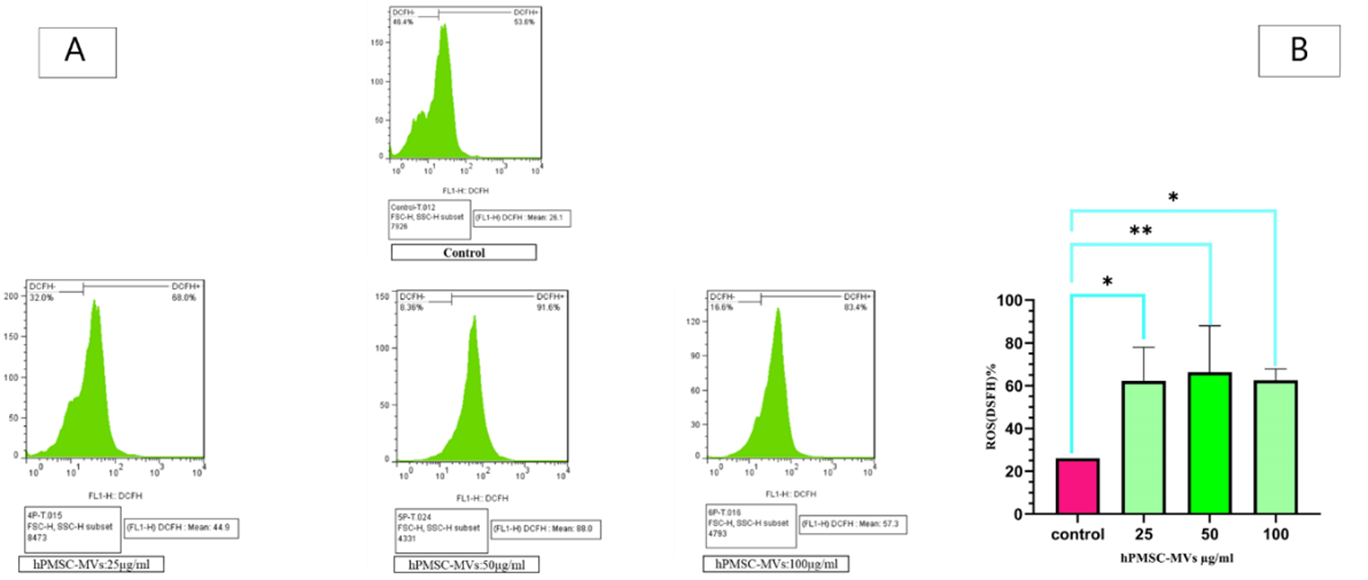
After treating KG1 cells with hPMSC-MVs at three concentrations of 25, 50, and 100 μg/mL for 24 hours, intracellular ROS measurement was performed in KG1 cells. The accumulation was measured using DCFH2-DA. Figure 3 shows the results of ROS activity after the treatment of KG1 cells with hPMSC-MVs at three concentrations of 25, 50, and 100 μg/mL. The mean intracellular ROS accumulation at the concentrations of 25, 50, and 100 μg / ml and in the group control were 62.21% (P<0.0002), 66.25% (P<0.0001), 62.55% (P<0.0001) and 26.1% (P<0.0001), respectively.
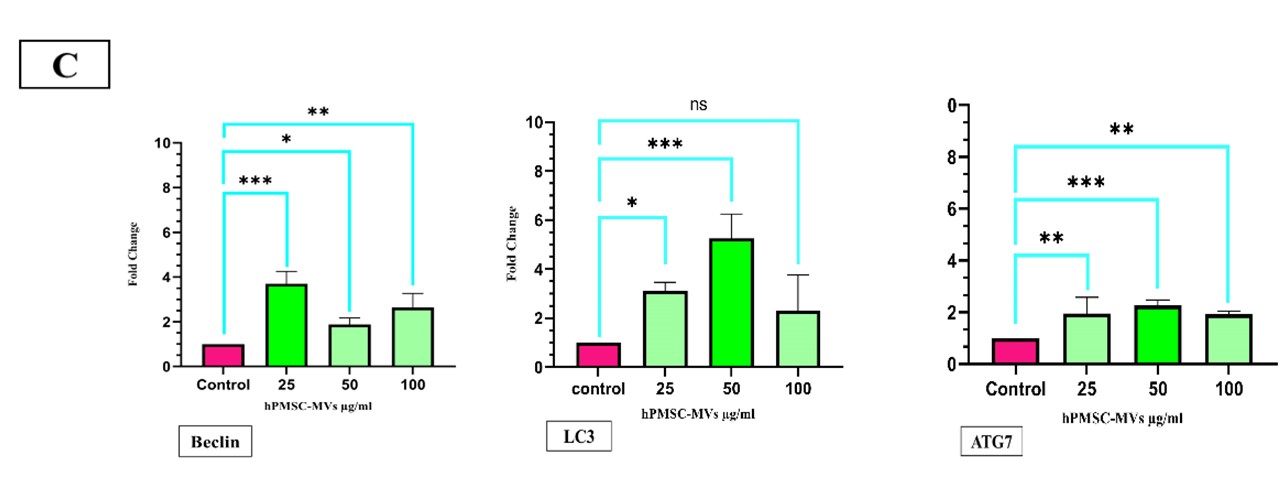
Increased expression of autophagy genes in KG1 cells after being treated with hPMSC-MVs
To determine autophagy in KG1 cell culture with hPMSC-MVs, the expressions of autophagy genes Beclin1, LC3, and ATG7 were determined by RT-PCR. The results showed the expression of ATG7 almost 1.95-fold at the concentration of 25 μg/ml (P<0.0042), 2.26-fold at the concentration of 50 μg/ml (P<0.0009), and 1.92-fold at the concentration of 100 μg/ml (P<0.0042), all of which were statistically significant. The expression level of LC3 was approximately 3.11-fold at the concentration of 25 μg/ml (P<0.0042) and 5.25-fold at the concentration of 50 μg/ml (P<0.0001), which were statistically significant. The expression of LC3 was 2.3-fold at the concentration of 100 μg/ml (P<0.0552), which was statistically insignificant. The expression of the Beclin1 gene was 3.69-fold at the concentration of 25 μg/ml (P<0.001), 1.87-fold at the concentration of 50 (P<0.0009), and 2.64-fold at the concentration of 100 μg/ml (P<0.0009), which significantly increased in KG-1 cells after being treated with hPMSC-MVs, compared to the control group at all three concentrations after 24 hours (Figure 3).
To determine apoptosis in KG1 cells after being treated with hPMSC-MVs, an apoptosis analysis was conducted by kit Annexin V-FITC. Data found that apoptosis increased in KG1 cells after being exposed to MSC-MVs at three concentrations of 25, 50, and 100 μg / ml for 24 hours, compared to the control group. The apoptosis metrics of the three categories (KG1 cells +25 μg /ml protein hPMSC-MVs, KG1 +50 μg /ml protein hPMSC-MVs, KG1 +100 μg /ml protein hPMSC-MVs) were 62.6% (P<0.0002), 46.0% (P<0.0001), and 48.2% (P<0.0001), respectively, compared to the control group (Figure 4).
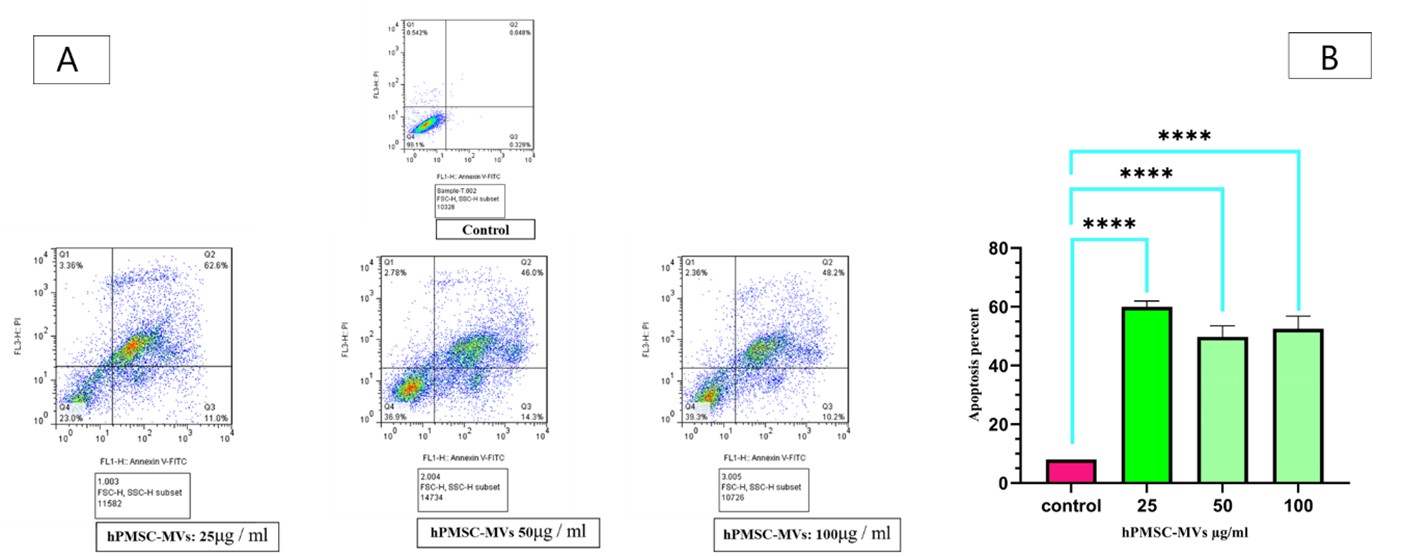
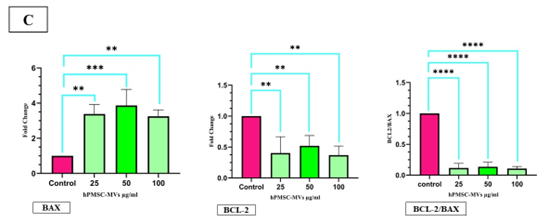
Figure 4. Effects of hPMSC-MVs on cell survival. (A) Flow cytometry results related to the measurement of apoptosis in KG1 cells after being treated with hPMSC-MVs at the concentrations of 25, 50, and 100 μg / ml, and the control group. (B) The data (mean fluorescence for each group) was demonstrated as bar charts below the profiles (error bars indicate the SD of triplicate experiments). **** P<0.0001, the number signs were used to mark the statistical significance. (C)The expression of the BAX gene in KG1 cells after being treated with hPMSC-MVs at the concentrations of 25, 50, and 100 μg / ml, compared to the control group, exhibited a notable increase, whereas the expression of the BCL-2 gene saw a significant decrease. Also, the Bcl-2/Bax ratio reduced significantly in the groups treated with different concentrations of hPMSC-MVs. **P<0.0005, ***P<0.001, and ****P<0.0007. The number signs were applied to mark the statistical significance.
The impact of hPMSC-MVs on the expression level of mRNA of selected genes associated with apoptosis was analyzed by RT-PCR. After treating KG1 cells with hPMSC-MVs, the mRNA expression of BAX was almost 3.38-fold at the concentration of 25 μg/ml (P<0.0007), 3.87-fold at the concentration of 50 μg/ml (P<0.0007), and 3.25-fold at the concentration of 100 μg/ml (P<0.001), which increased significantly. The mRNA expression of BCL-2 was approximately 0.45-fold at the concentration of 25 μg/ml (P<0.001), 0.52-fold at the concentration of 50 (P<0.0005), and 0.37-fold at the concentration of 100 μg/ml (P<0.0007), which significantly decreased compared to the control group. Assessing the apoptosis level often involves the analysis of the Bcl-2/Bax ratio. The findings show this ratio markedly decreased (P<0.0005) in the groups exposed to different concentrations of hucMSC-MVs (Figure 4).
Discussion
MSCs have a dual function in cancer advancement by producing a large number of bioactive factors like MVs. Although MSC-derived MVs can promote tumor growth and metastasis, they can be also employed in inhibiting tumor cell growth (14, 15). As indicated by evidence, MSCs show properties against a variety of malignancies such as Kaposi's sarcoma (16), Glioma (17), breast cancer (18, 19), and Non-Hodgkin's Lymphoma (20). Cell-to-cell communication and the soluble elements secreted by MSCs, such as MVs, inhibit cancer cell growth in vitro. Latterly, the key role of MVs in cell-to-cell communication and their involvement in target cell reprogramming through signaling pathways have come into the spotlight (21, 22). Indeed, MVs released from MSCs contain selected mRNA and miRNA patterns that can be transported to the target cells via receptor-mediated mechanisms (23, 24). Studies have reported that MVs inhibit growth, proliferation, and cell cycle progression in tumor cells, and also increase apoptosis in cancer cells (25, 7). Considering the therapeutic possibilities of MVs, MVs are promising candidates for cancer therapy in the near future.
In this paper, MVs were effectively isolated from the supernatant of hPMSCs that were characterized by heterogeneous lipid bi-layer vesicles varying from 100–1000 nm. Our data showed that MVs potently induced autophagy and apoptosis cell death pathways in KG1 cancer cell lines and led to the death of these cells.
Cancer cells deliberately reduce autophagy by increasing the Akt activity, contributing to the mTOR signaling pathway (26), inducing uniaxial deletion of the Beclin-1 gene (27), and reducing the expression of PTEN / p53 tumor suppressors (28). Among regulatory genes in autophagy, Beclin-1, LC3, and ATGs are prominent (29). In this study, the expression of Beclin-1, LC3, and ATG7 genes are investigated.
To examine the impact of PMSC-MVs on the autophagy pathway in an acute myeloid leukemia cell line, KG1 cells were treated with MVs at three concentrations of 25, 50, and 100 μg / ml for 24 hours. It was necessary to examine ROS accumulation and autophagy gene expression to determine the autophagy activation in treated cells. The measured ROS accumulation level in the KG1 cells by DCFH-DA shows that this molecule increases in these cells, compared to the control group. The mean accumulation of intracellular ROS in co-cultured cells with MVs at the concentrations of 25, 50, and 100 μg / ml is 62.21% (P<0.0002), 66.25% (P<0.0001), and 62.55% (P<0.0001), respectively. While, in the control group, the mean accumulation of intracellular ROS is 26.1% (P<0.0001). The greatest increase in ROS expression in cancer cells was observed at the concentration of 50 μg / ml of MVs, and at this concentration, ROS expression is 3.57 times higher than in the control group. ROS is formed by the incomplete reduction of an oxygen electron. These molecules incorporate oxygen anions, free radicals such as superoxide, hydroxyl radicals, and peroxides, such as hydrogen peroxide (30). Since ROS and autophagy are similarly involved in the survival and cell death pathway, as well as cancer progression and treatment, the regulation of autophagy by ROS has been investigated (31).
Ingrid Kiššová and colleagues, in their study on yeast, declared that mitochondrial oxidation, lipid oxidation, and ROS production play a role in inducing autophagy (32). Studies on mammalian cells also showed that ROS is an important regulator of autophagy. A study of lung cancer by Jiangjiang Fan indicated that cancer cells exposed to Bruceine D showed a significant increase in ROS level. In addition, a study of LC3 and ATG7 autophagy genes revealed that increased ROS induces autophagy in cancer cells and ultimately inhibits their growth (33). In the present study, the examination of Beclin-1, LC3, and ATG genes by RT-PCR demonstrated that the expression level of these genes in cells receiving MVs (concentrations of 25, 50, and 100 μg / ml) increased compared to the control group. This can be considered a consequence of ROS intracellular accumulation. According to the capability of PMSC-MVs in inducing autophagy, it can be concluded that PMSC-MVs are pro-apoptotic elements for the KG1 cell line. In this study, the effect of PMSC-MVs on the rate of apoptosis in the KG1 AML cell line was assessed following 24 hours of incubation using flow cytometry. In KG1 cells co-cultured with PMSC-MVs, at all three concentrations of 25, 50, and 100 μg / ml, the apoptosis of leukemia cells increased significantly compared to the control group. The mean percentages of late apoptotic cells at concentrations of 25, 50, and 100 μg/ml were 62.6%, 46.0%, and 48.2%, respectively. In addition, the percentage of living cells at the concentrations of 25, 50, and 100 μg / ml of MVs showed a dose-dependent decrease compared to the control group (percentage of living cells in 25, 50, and 100 μg / ml of MVs were 23.0%, 36.9%, and 39.3%, respectively).
Therefore, according to our flow cytometric findings, apoptosis increased after KG1 leukemia cells were exposed to different concentrations of MVs. Consistent with our data, the findings of a study by Muneerah A. H. Huwaikem in 2021 showed that the co-culture of MSCs derived from Wharton's blood Warton gel with K562 cells is associated with the induction of apoptosis in these cells. In addition, the expression level of BAX and caspase-3 genes elevated (34).
Apoptosis is a coordinated biochemical process that ultimately leads to cell death, contributing to the control of cellular growth and cellular proliferation. Apoptosis also prevents cancer incidence in various cell lines. If for any reason, the apoptotic process is disrupted, cell death will not occur as planned, and subsequently, uncontrolled proliferation will happen (35). There is a need for extensive regulatory genes in apoptosis pathways. The large BCL-2 family is one of the most important apoptosis-regulating molecules. This family comprises anti-apoptotic components, such as BCL-2 and BCL-XL, and pro-apoptotic components, such as BAX and BAK. These protein molecules are involved in the internal or mitochondrial apoptosis pathway and seem to control the components reciprocally by hetero-dimerization (36). Yuan Ji and colleagues, who treated MVs released from MSCs derived from human embryonic stem cells with K562 and HL60 cells, demonstrated an increase in BCL-2 and a reduction in BAX protein. BCL-2 / BAX ratio also exhibited a notable reduction at a concentration of 30 (P<0.05) and also at a concentration of 60 (P<0.01) (37). In this study, qRT-PCR results showed that at all three concentrations, the expression of the BCL-2 gene in KG1 cells grown in the presence of PMSC-MVs significantly decreased compared to the control group. In addition, the expression of the BAX gene, as a pro-apoptotic and induced protein in the internal pathway of apoptosis, significantly increased in all samples compared to the control group, with the highest level of expression at the concentration of 50 μg / ml. Also, the BCL-2 / BAX ratio, which is an important indicator in the study of the apoptotic process, showed a very significant decrease.
Conclusion
Taken together, our study shows that hPMSC-MVs induce cell death pathways of autophagy and apoptosis in KG1 cell lines, exert potent anti-proliferative, and have pro-apoptotic impacts on KG1 cells in vitro. Accordingly, the utilization of hPMSC-MVs will be probably a promising approach in AML therapy.
Acknowledgements
The authors acknowledge the financial provided by the Department of Hematology and Blood Transfusion Sciences at Tehran University of Medical Sciences.
Conflicts of Interest
All authors have no conflict of interest to declare.
Funding
Funding for this project was provided by the Tehran University of Medical Sciences Foundation, grant number: 95-01-31-31461.
Authors' contributions
Study conception and design: Seyed Hadi Mousavi, Shaban Alizadeh, Jamal Motallebzadeh Khanmiri; Acquisition of data: Jamal Motallebzadeh Khanmiri, Mohammad Khani-Eshratabadi; Analysis and interpretation of data: Seyed Hadi Mousavi and Jamal Motallebzadeh Khanmiri; Writing of the paper: Jamal Motallebzadeh Khanmiri; Review and editing: Seyed Hadi Mousavi, Jamal Motallebzadeh Khanmiri, and Maedeh Masoumipour.
Received: 2023/06/26 | Accepted: 2023/09/29 | Published: 2024/01/29
| Rights and permissions | |
 |
This work is licensed under a Creative Commons Attribution-NonCommercial 4.0 International License. |
Copyright Policy
